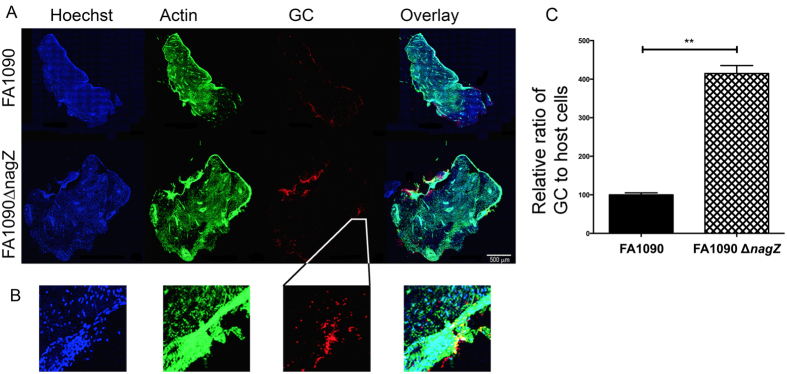
Figure 6. Gonococcal biofilm formation on cervical explants.
Gonococci were allowed to form biofilms for 48 hrs on cervical explant tissue and after fixation visualized by confocal microscopy. Panel (A) shows the tissue stained for DNA (Hoechst - blue), actin (phalloidin - green), and gonococci (anti-GC antibody - red). The right most part of panel (A) shows an overlay of all channels. Scale bar corresponds to 500 μm. Panel (B) is an enlargement of the same area as shown in panel (A) to allow for visualization of distinct nuclei. All enlarged areas are derived from the same position as indicated for GC. The biomass of GC on cervical explant tissue was measured by normalizing the ratio of mean fluorescence intensity (MFI) of gonococci on the biofilm to the relative nuclear staining. Samples from the wild type strain were normalized to 100%. Results are average of 10 independent fields from two independent experiments. The significance of the differences was determined with Student’s t-test. (***p < 0.001).

