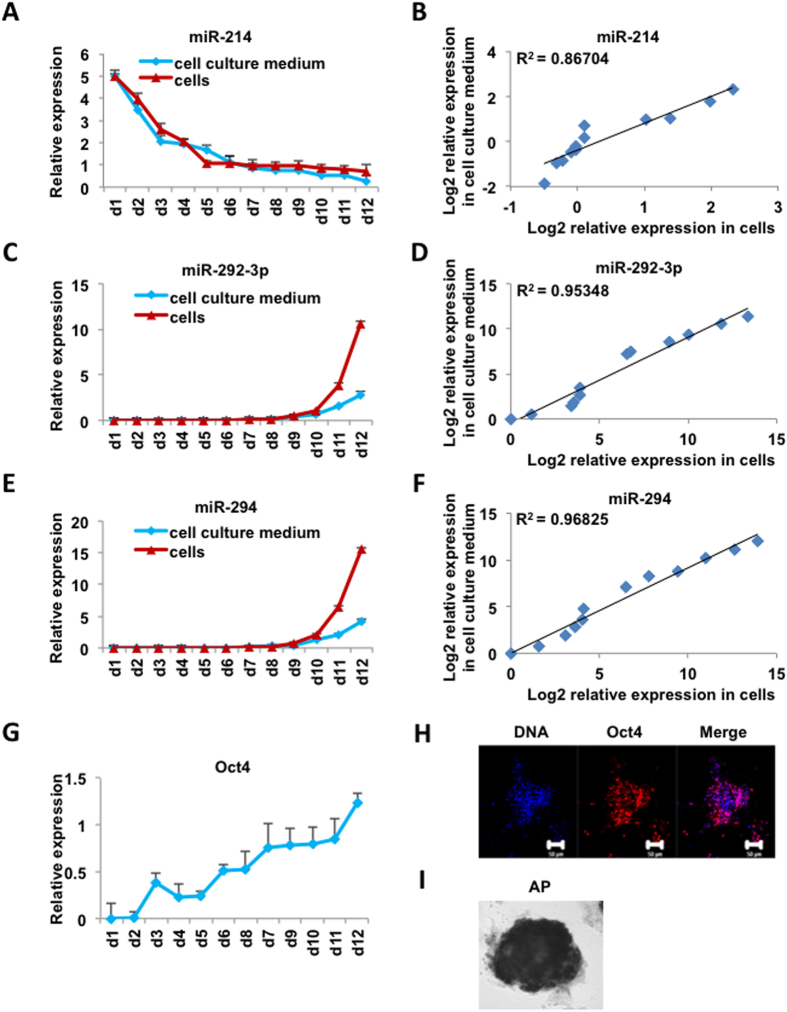
Figure 1. Expression profiles of miRNAs in cells and cell culture mediums during the iPSC generation process.
(A) Relative expression levels of miRNA-214 in cell culture mediums and cells evaluated by real-time PCR. (B) Correlation analysis of miRNA-214 expression (log2 transformed) in cell culture mediums and corresponding cells (p-value = 1.086e-05, two-sided Pearson correlation analysis). (C) Relative expression levels of miRNA-292-3p in cell culture mediums and cells evaluated by real-time PCR. (D) Correlation analysis of miRNA-292-3p expression (log2 transformed) in cell culture mediums and corresponding cells (p-value = 5.47e-08, two-sided Pearson correlation analysis). (E) Relative expression levels of miRNA-294 in cell culture mediums and cells evaluated by real-time PCR. (F) Correlation analysis of miRNA-294 in cell culture mediums and corresponding cells (p-value = 8.052e-09, two-sided Pearson correlation analysis). (G) Relative expression levels of Oct4 in cells evaluated by real-time PCR. (H) Immunostaining of Oct4 protein in iPSCs. Positive Oct4 fluorescence (red) was observed, DNA was stained by Hoechst 33342 (blue). Shown are mouse iPSCs generated in KOSR-based medium. (I) AP-positive clones obtained from reprogrammed MEF cells. The x-axis of (A), (C), (E), (G) represents the dates during the reprogramming process. Pluripotent iPSCs were obtained at day12.

