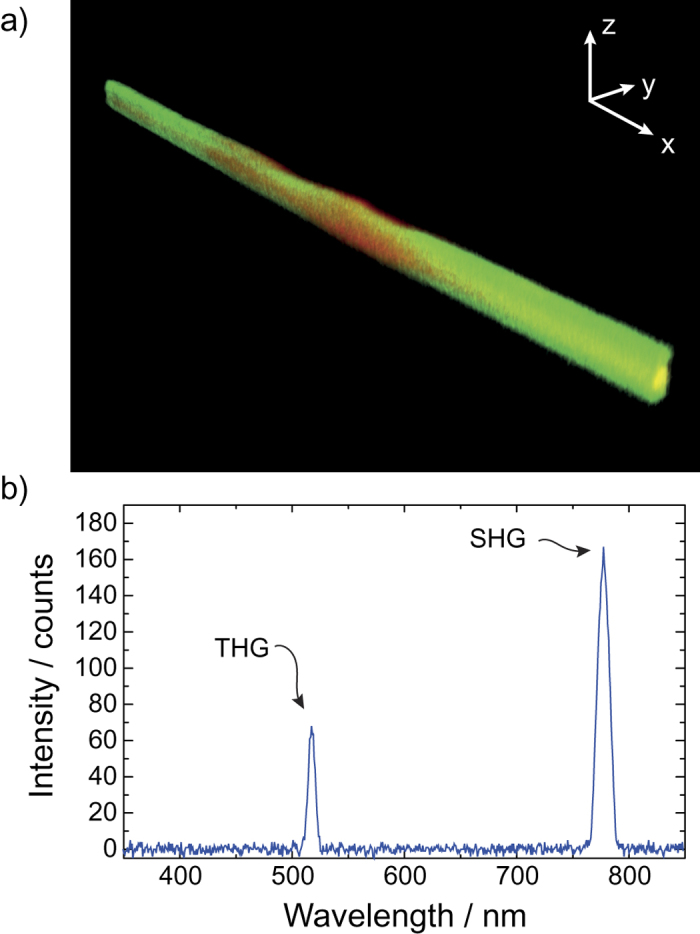
Figure 6.

(a) Reconstructed image of the silk fiber, as imaged using a multiphoton microscope (1560 nm excitation femtosecond fiber laser). Colors: SHG - red and THG - green. Yellow areas produce both signals. (b) Optical spectrum of the measured SH and TH signals indicates that the signals are indeed due to SHG and THG, respectively.
