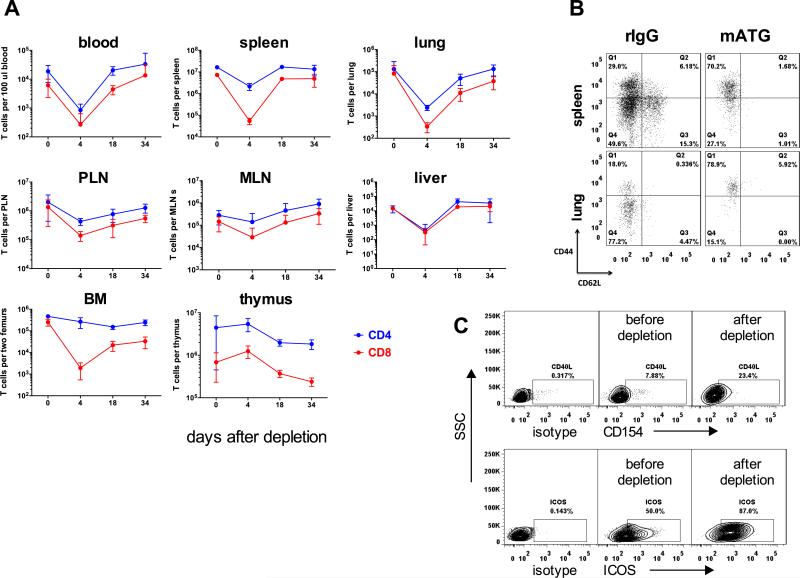
Figure 1. Effector/memory CD4 T cells dominate T cell repertoire following mATG depletion.
Naïve C57BL/6 mice were injected with mATG or control rIgG (1.0 mg i.p. on days 0, 4) and sacrificed at indicated time points after depletion. A. The absolute numbers of CD4+ and CD8+ T cells in various anatomical compartments are presented as mean ±SD for 3-4 mice per group. The experiment was performed twice with similar results. B-C. The phenotype of residual CD4+ T cells on d. 4 after first mATG injection. Representative flow cytometry plots from two independent experiments (N = 3-4 mice per group) are shown after gating on CD4+ cells. The numbers indicate percentages of cells within gates.

