
Fig. 6. G5-7 suppresses angiogenesis in tumors.
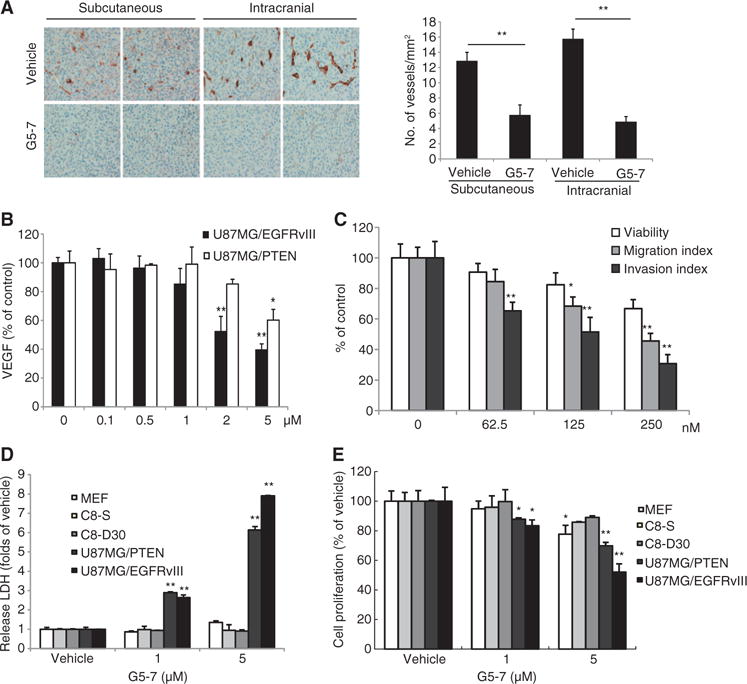
(A) Analysis of angiogenesis using endothelial cell marker CD31 in intracranial or subcutaneous tumors from mice treated with or without G5-7. The number of vascular structures per square millimeter in the tumor xenografts was quantified by counting three different 10× microscopic fields for each section per mouse (three mice for each group). The three fields were averaged in each tumor, and the averages for each animal were used to give the final mean ± SEM (*P < 0.05, **P < 0.01, two-tailed Student’s t test, n = 3). (B) Enzyme-linked immunosorbent assay (ELISA) analysis measuring the secretion of VEGF in U87MG/EGFRvIII and U87MG/PTEN cell lines treated with a range of doses of G5-7 for 24 hours (*P < 0.05, **P < 0.01, one-way ANOVA, n = 3). (C) Analysis of migration and invasion of HUVECs treated with a dose range of G5-7. Data are means ± SEM (*P < 0.05, **P < 0.01, one-way ANOVA, n = 3). (D) Cytotoxicity analysis with LDH in MEFs, astrocyte cell lines (C8-S and C8-30), and glioma cell lines (U87MG/PTEN and U87MG/EGFRvIII) after treatment with G5-7 (*P < 0.05, **P < 0.01, one-way ANOVA, n = 3). (E) Cell proliferation assay using the same cells treated the same way as in (D) (*P < 0.05, **P < 0.01, one-way ANOVA, n = 3).