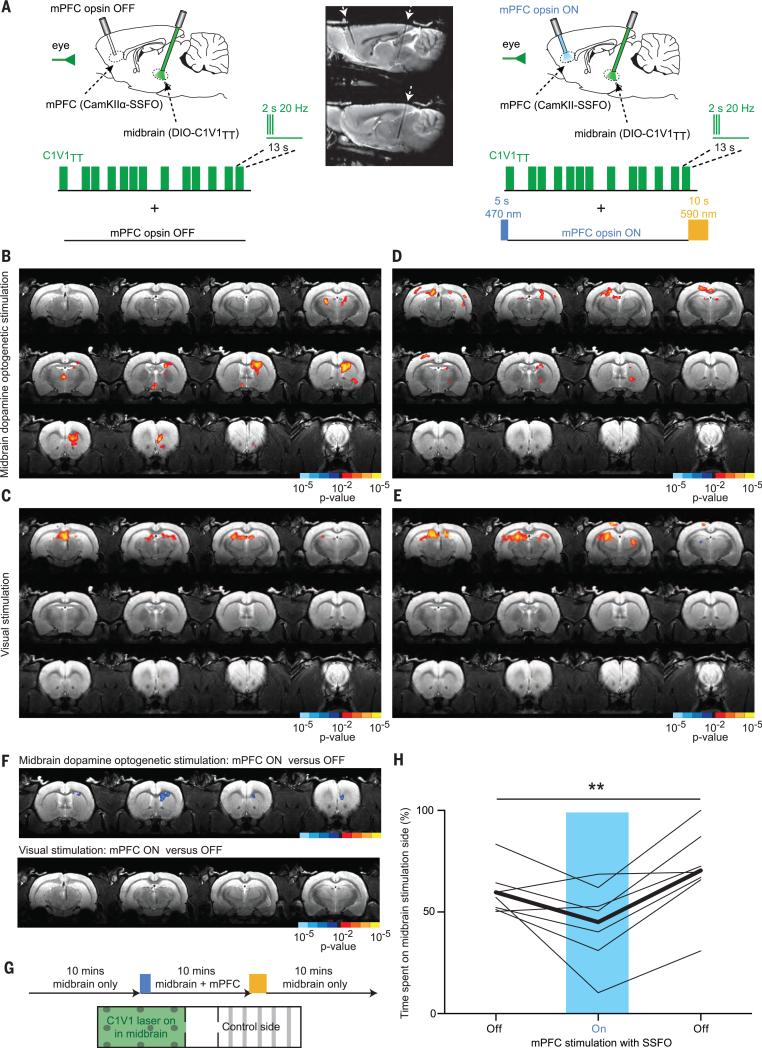
Fig. 5. Cortical suppression of striatal BOLD and behavioral response to midbrain dopaminergic stimulation.
(A) Schematic illustrating the design of the dual-stimulation experiment.The sagittal T2 anatomy scan (two adjacent sections shown) demonstrates the angled orientation of the two fibers. (B) Brain-wide Z-score map of BOLD activity in response to C1V1TTstimulation in midbrain dopaminergic neurons and (C) visual stimulation alone (n = 6 rats, 32 runs). (D) Z-score map in response to C1V1TTstimulation and (E) visual stimulation in combination with SSFO activation in the mPFC (n = 6 rats, 32 runs). (F) Statistical comparison of mPFC-activated versus nonactivated condition for midbrain dopaminergic stimulation and visual stimulation. (G) Real-time place preference test for C1V1TTstimulation alone and in combination with mPFC activation with SSFO. The percentage of time spent on the C1V1TT stimulation side was assessed for all three bursts. (H) One-way repeated measures ANOVA shows a significant effect of mPFC activation (**P = 0.0047, F = 8.652, number of groups = 3, number of rats = 7), with a significant difference from baseline and washout conditions after Newman-Keuls multiple comparison testing.

