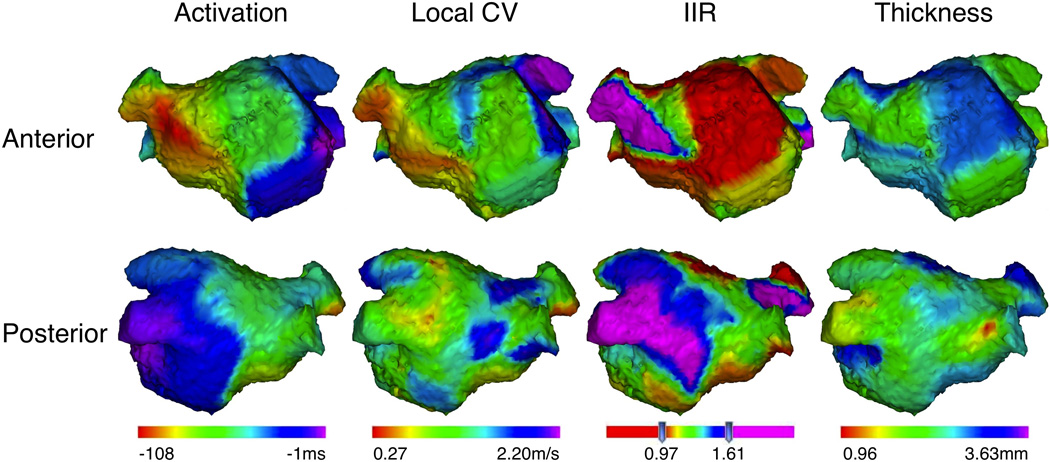
Figure 2.

Three-dimensional maps in a representative case. The upper and lower panels show the anterior and posterior projections of three-dimensional LA images merged with the data of local activation time, local CV, IIR, and wall thickness, respectively. Left atrial appendage was excluded from the figures.
