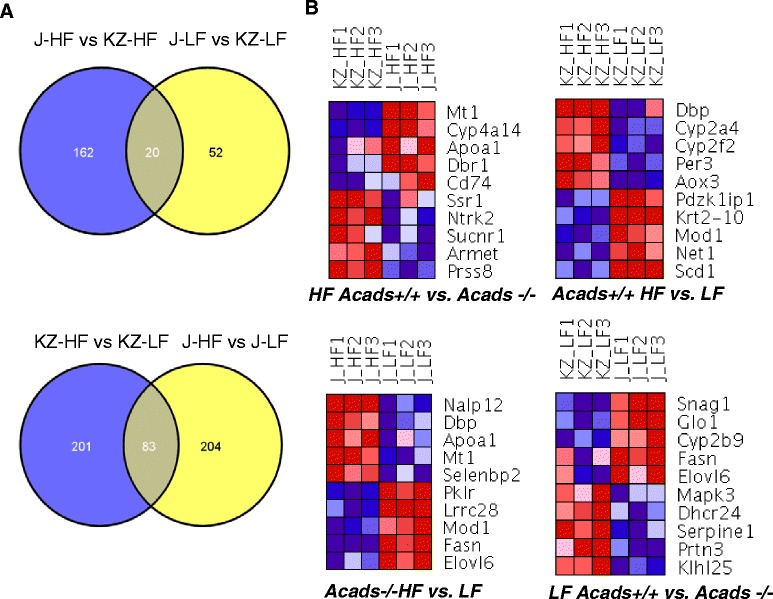
Fig. 4.

Venn diagrams of differentially expressed genes affected by diet and genotype along with two-way Ward clustering of top 5 increased and top 5 decreased genes. Legend: a Overlap among significantly differentially expressed (DE) genes from each treatment (genotype, diet). Genes with an absolute fold change ≥ 1.5-fold and a nominal p-value <0.01 were considered to be significantly DE. b Two-way Ward clustering of top significantly DE genes. Treatments are organized by columns and genes by rows (expression levels in the heatmap are color-coded with blue representing lower and red representing higher levels of mRNA abundance). J, BALB/cByJ or Acads−/−; KZ, BALB/ByKZ, or Acads+/+
