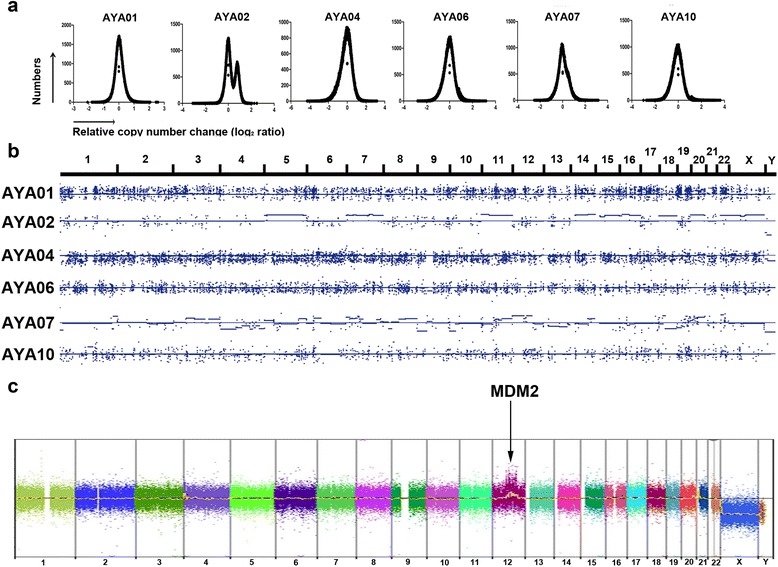
Fig. 3.

Analysis of CNVs in AYA cancers. a Distributions of relative copy number change (C) in AYA cancers, shown on a log2 scale. b Chromosome-level alterations are shown and were processed by VarScan2. Similar patterns were detected by OncoScan™ (Additional file 1: Figure S3). c OncoScan™ identified a focal amplification of MDM2 in AYA10
