Figure 1.
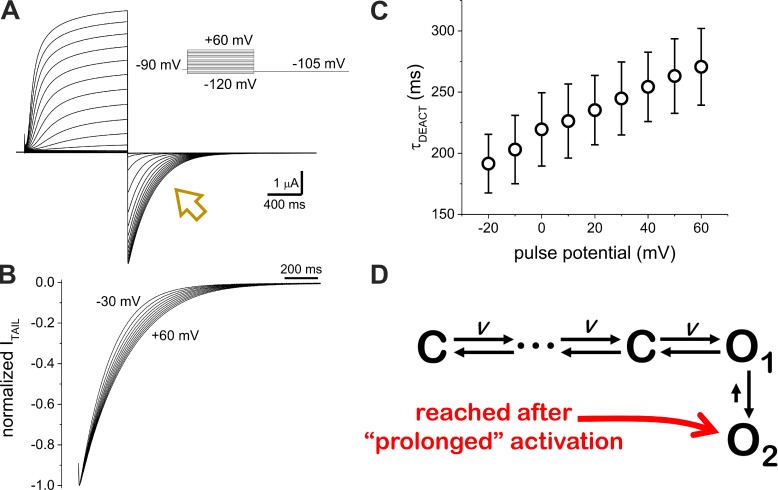
K+ deactivation rate decreases as a function of activation. (A) K+ currents recorded from Xenopus oocytes coexpressing human KV7.2 and KV7.3 channels using the cut-open voltage-clamp technique. Test pulses ranging from −120 mV to +60 mV were applied from an HP of −90 mV. Deactivation of the current was driven at −105 mV (arrow). (B) Normalized deactivating currents from activating pulses from −30 to +60 mV. Deactivation slowed down after higher activating potentials. (C) Deactivation time constant (τDEACT) versus test pulse potential (τDEACT–VPULSE) plot. Error bars represent standard deviation. (D) Kinetics scheme describing alternative pathways for the deactivation of the heteromeric KV7.2/KV7.3 channel. Voltage-dependent transitions are noted with V.

