Figure 3.
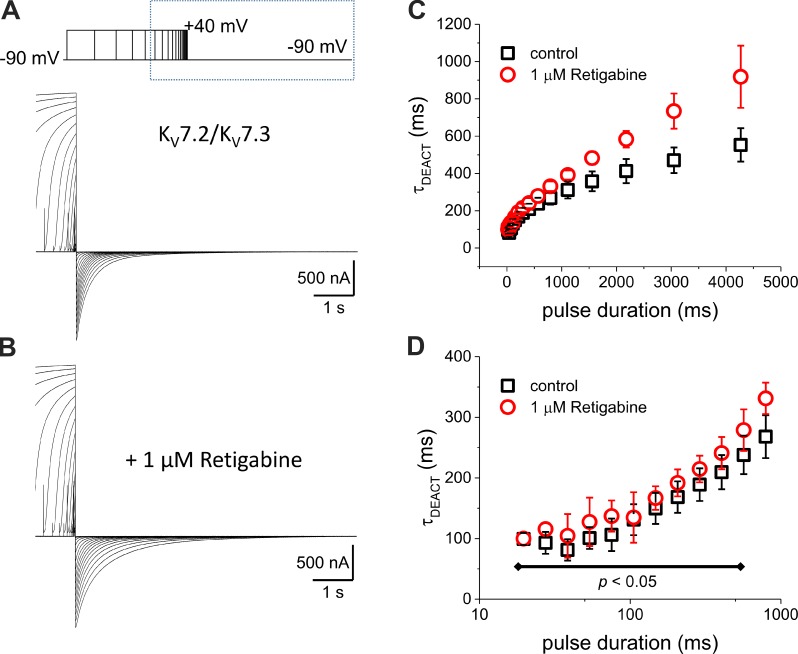
Deactivation time constant increase as a function of the duration of the activating pulse. (A and B) K+ currents were activated by 40-mV pulses with a duration varying from 10 to 4,175 ms in the absence (A) and presence (B) of 1-µM Retigabine. The duration of the pulse increased 1.3-fold for each trace. After activation, the K+ current was deactivated at −90 mV. (C) τDEACT–tPULSE plot shows that τDEACT increased as the activating pulse was longer (black squares). In the presence of Retigabine, τDEACT increased further. (D) The same plot as in C, but the tPULSE is displayed in a logarithmic scale to highlight the τDEACT–tPULSE relationship for shorter activating pulses and showing that τDEACT was unaltered by Retigabine for pulses shorter than 500 ms. Error bars represent standard deviation. Control, n = 7; Retigabine, n = 6.

