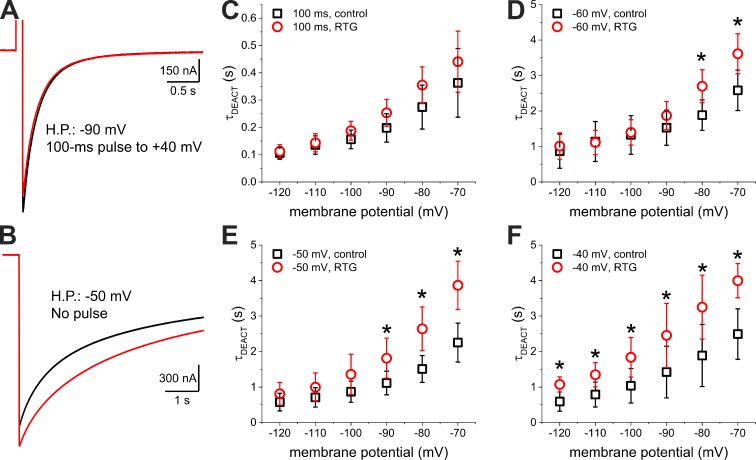
Figure 4.
Deactivation from the depolarized and resting potential open states. (A) Deactivation at −90 mV of the K+ current elicited by a 100-ms depolarization to 40 mV in the absence (black trace) and presence of 1-µM Retigabine (red trace). (B) Deactivation at −90 mV of the K+ current elicited by holding the membrane potential at −50 mV also in the absence (black trace) and presence of 1-µM Retigabine (red trace). (C–-F) Deactivation time constant (τDEACT) versus deactivating potential (τDEACT–VDEACT) plot of channels activated by a 100-ms depolarization to 40 mV (C) or by holding the membrane potential at −60 mV, −50 mV, and −40 mV (D, E, and F, respectively) in the absence (black squares) and presence of 1-µM Retigabine (RTG; red circles). Error bars represent standard deviation. t test; n = 5–8. *, P < 0.05, t test.

