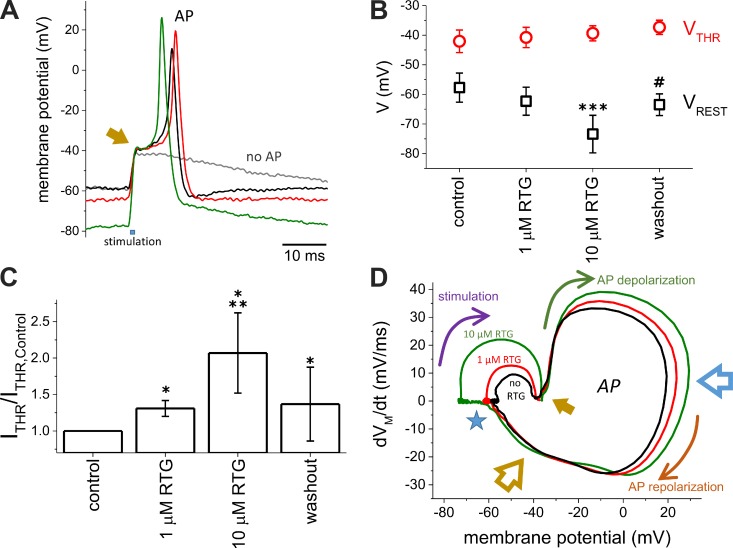
Figure 5.
The resting potential, but not the threshold potential for triggering AP, was affected by Retigabine. (A) APs were recorded from Xenopus oocytes coexpressing both the α and β subunits of NaV1.4, ShakerIR, KV7.2, and KV7.3. The APs were recorded using the loose two-electrode voltage-clamp technique (see Materials and methods for details) in the absence (black trace) or presence of 1-µM (red trace) or 10-µM (green trace) Retigabine. The gray trace shows the response of VM when a subthreshold was applied. The arrow indicates the moment at which AP threshold (VTHR) is reached. (B) Effect of Retigabine (RTG) on the resting membrane potential (VREST) and AP threshold (VTHR). (C) Minimum current injection needed to evoke an AP (ITHR). The values of ITHR were normalized by ITHR in the absence of Retigabine (n = 4). (D) Example of a phase plot calculated from the APs shown on A. VREST was strongly affected by Retigabine (blue star), whereas VTHR remained fairly unaltered. Although the depolarization phase was affected by Retigabine (blue arrow), the late phase of repolarization (yellow arrow) remained unaltered. Arrows indicate the progress of the AP in time during the stimulation phase (purple arrow), depolarization phase (green arrow), and repolarization phase (orange arrow). The open blue arrow points at the times when APs reached their maximum voltage. The open yellow arrow points at the late repolarization phase. Error bars represent standard deviation. t test; n = 5. *, P < 0.002 with respect to control; **, P < 0.07 with respect to 1-µM Retigabine; ***, P < 0.0025 with respect to control; #, P < 0.072 with respect to control.

