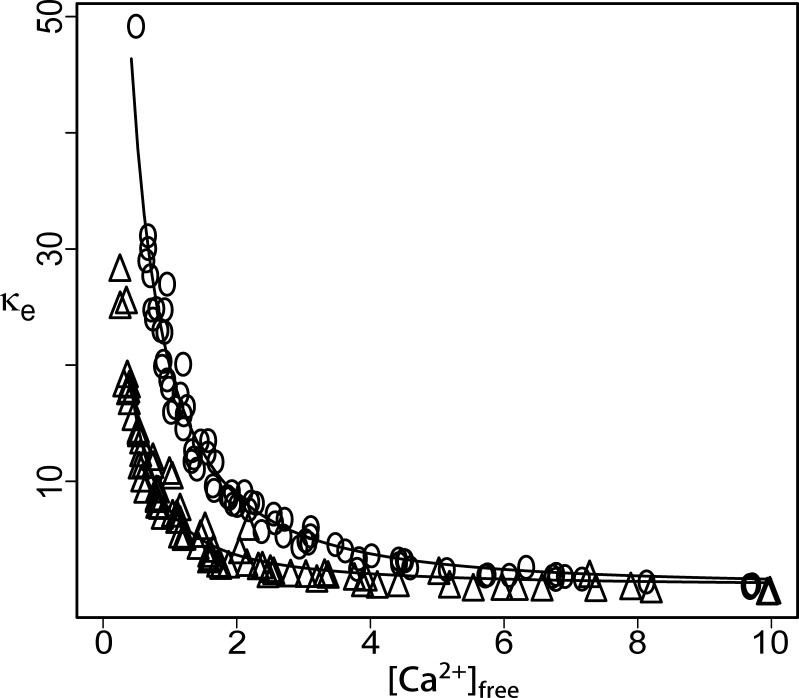
Figure 6.
Endogenous Ca2+ buffering capacity (κe) is reduced during the ∼10 min of whole-cell recording. Open circles show κe shortly after break in. After 10 min of dialysis (open triangles), a significant fraction of the endogenous buffering capacity was lost. Smooth curves show the model fits from trains collected at the relevant time points.

