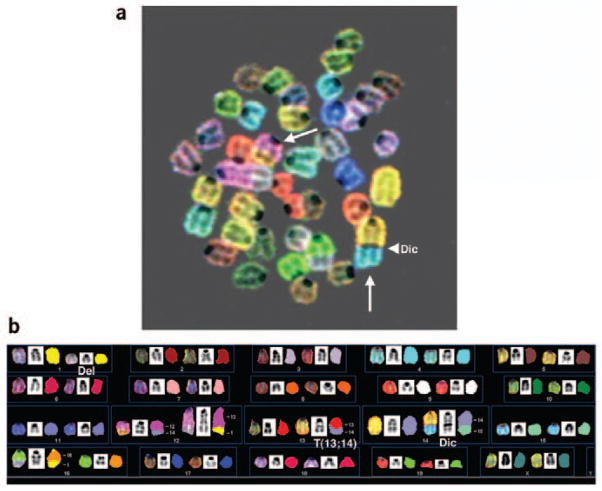
Figure 6.
Mouse spectral karyotyping. (a) SKY image of a metaphase spread from a mouse deficient for the gene mutated in the human disease ataxia telangectasia was overlayed onto the corresponding DAPI-banded image. White arrows indicate two chromosome translocations frequently observed in this mouse model system, T(12;14) and Dic(14;15). (Using mouse cytogenetic nomenclature rules, T denotes a translocation where the chromosome listed first contains the centromere; Del denotes a deletion; Dic denotes a chromosome containing two centromeres (dicentric), one from each one of the contributing chromosomes.) The arrowhead indicates the presence of a centromere at the fusion of chromosomes 14 (yellow) and 15 (blue) in the dicentric chromosome, Dic(14;15). (b) Karyotyping corresponding to the metaphase spread shown in a. Each chromosome is represented from left to right by the display color, the inverted DAPI counter-stain and the classification pseudo-color. Numbers to the right of each translocation chromosome indicate the chromosomal origin of each fragment. T(13;14) is an example of an unbalanced translocation, resulting from loss of some genomic material from chromosome 13 and the gain of a portion of chromosome 14.

