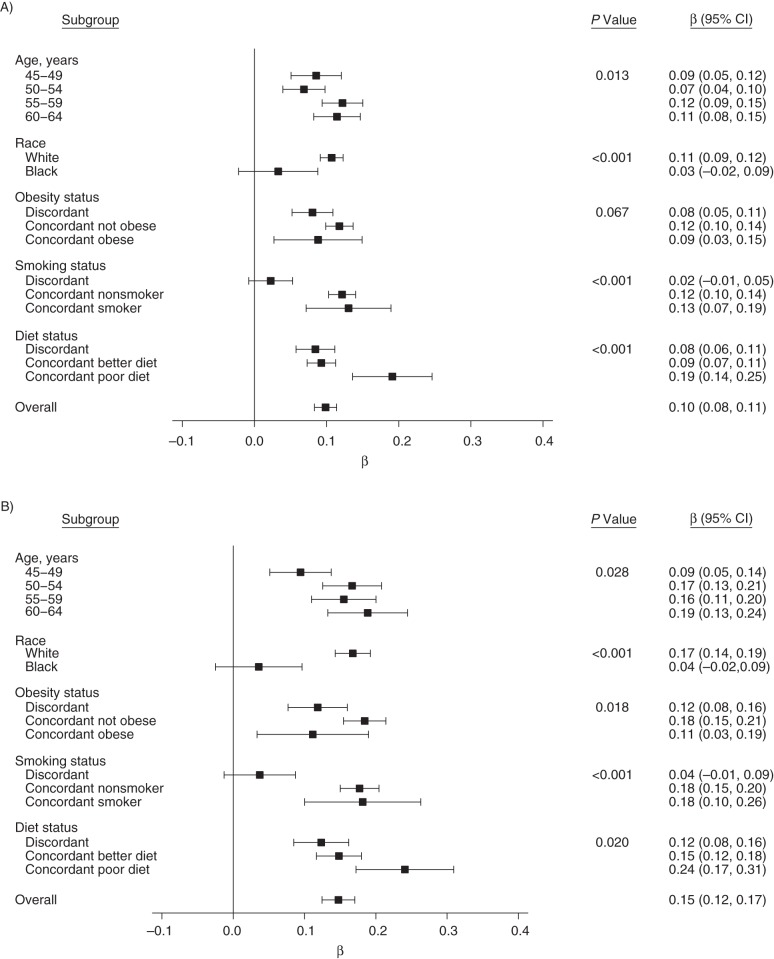
Figure 1.
Linear associations between changes in participants’ body mass indices and concurrent changes in spousal body mass indices, Atherosclerosis Risk in Communities Study, 1987–2013. Analyses are shown for men (A) and women (B), overall and by subgroup. β coefficients represent the change in body mass index associated with a 1-unit increase in a spouse's body mass index change. P values are for the interaction between each baseline characteristic and change in spousal body mass index. Models were adjusted for the following time-varying individual characteristics and spousal behaviors: age, time between visits, race, study site, employment, educational level, smoking status, calorie intake, cardiovascular diet score, alcohol intake, leisure and sport physical activity level, coronary heart disease, hypertension, diabetes, cancer, and lung disease. The models were not adjusted for the stratification variables.

