
Fig. 2.
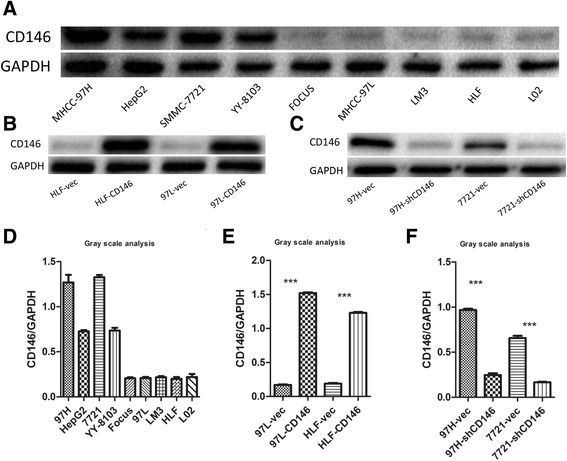
Construction of HCC cell lines stably overexpress or interfere CD146 expression. a Western Blot analysis of CD146 in HCC cell lines. b Construction of high CD146 expression cell lines. c Construction of low CD146 expression cell lines. d Gray scale analysis of CD146/GAPDH in a (n = 3). e Gray scale analysis of CD146/GAPDH in B (n = 3, ***P < 0.001). f Gray scale analysis of CD146/GAPDH in c (n = 3, ***P < 0.001)