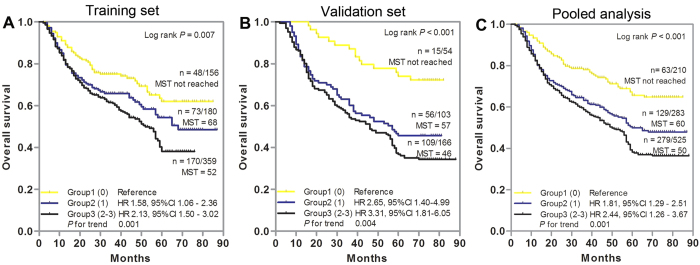
Figure 2. Cumulative analysis of unfavorable genotypes on the overall survival of gastric cancer patients.
(A) Training set, (B) Validation set, (C) Pooled analysis. Kaplan-Meier curve and multivariate Cox proportional hazards regression were used to estimate the cumulative effects of unfavorable genotypes. HRs were adjusted by age, sex, tumor site, tumor size, differentiation, TNM stage and adjuvant chemotherapy. Significant SNPs (P < 0.05) were included to categorize unfavorable genotype groups. MST indicates median event-free survival times (in months). Patient numbers may not add up to 100% of available subjects because of missing genotyping data.

