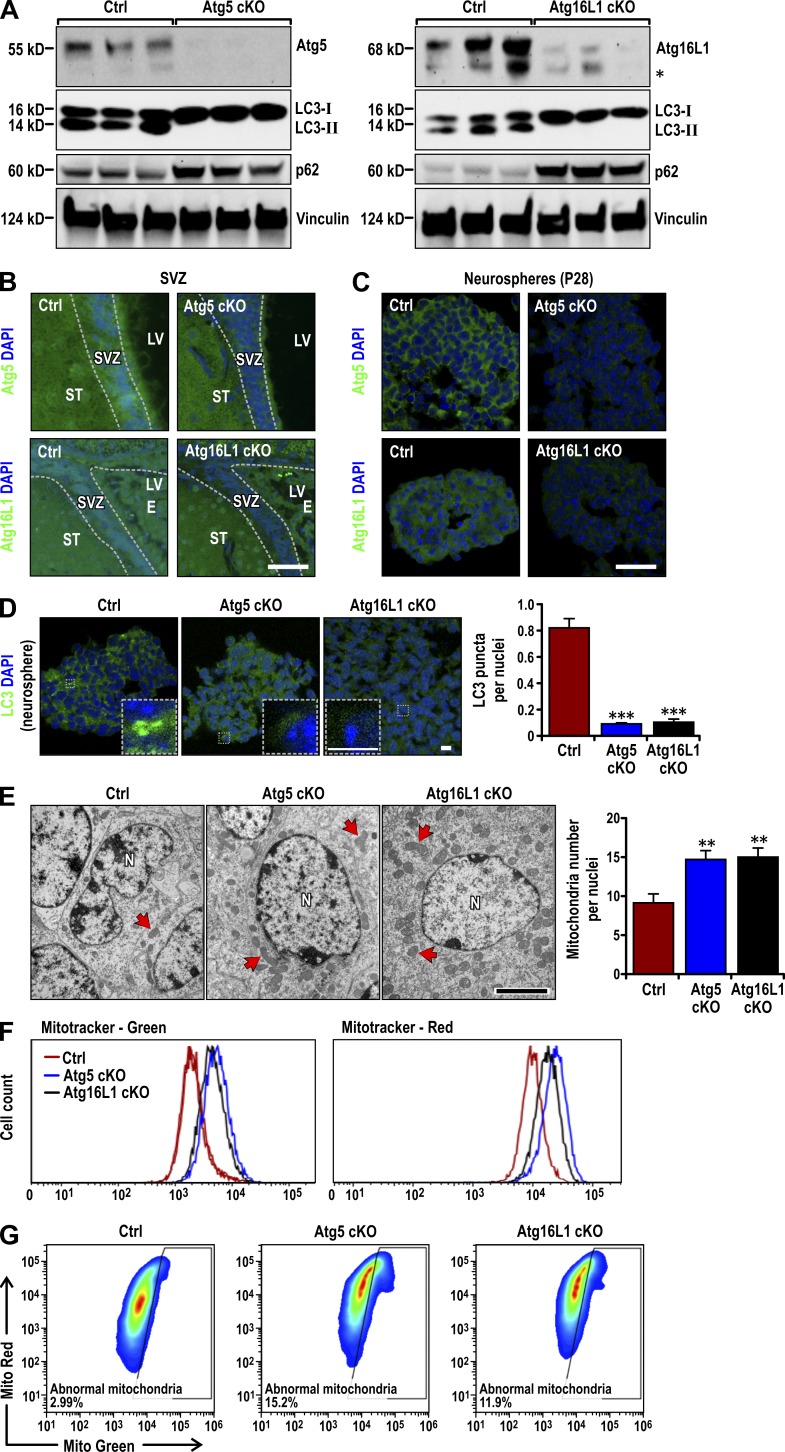
Figure 1.
Atg5 and Atg16L1 deletion causes deficient autophagy and mitochondria accumulation in postnatal NSCs. (A) Lysates were extracted from the SVZ of P14 Ctrl, Atg5GFAP cKO, and Atg16L1GFAP cKO mice treated with chloroquine for 7 d and analyzed by immunoblot to detect Atg5 (left), Atg16L1 (right), LC3, p62, and Vinculin. The asterisk on the right marks a band detected by anti-Atg16L1 antibody either nonspecifically or as a Atg16L1 degradation product in some samples. (B and C) Atg5, Atg16L1, and DAPI immunofluorescence in the SVZ (B; n = 3 mice each) and neurospheres (C) from Ctrl, Atg5GFAP cKO, and Atg16L1GFAP cKO SVZ cells at P28. (D) LC3 and DAPI immunofluorescence in neurospheres from Ctrl, Atg5GFAP cKO, and Atg16L1GFAP cKO SVZ cells at P28. Boxed areas show more detail for LC3 puncta. LC3 puncta number per nuclei (mean ± SEM) are graphed on the right (n = 3 mice each, >300 cells from three mice). (E) TEM of mitochondria (examples marked by arrows) in Ctrl, Atg5GFAP cKO and Atg16L1GFAP cKO SVZ tissues at P28. Mitochondria number per nuclei (mean ± SEM; n = 2 mice each, >30 cells from each mouse). (F) Total (MitoTracker Green) and functional (MitoTracker Red) mitochondria by FACS analysis of dissociated neurospheres cells from Ctrl, Atg5GFAP cKO, and Atg16L1GFAP cKO SVZ at P28 (n = 3 mice each). (G) Dysfunctional mitochondria were evaluated by the percentage of cells with decreased ratios of MitoTracker Red to MitoTracker Green (n = 2 mice each). E, ependymal layer; LV, lateral ventricle; N, nuclei; ST, striatum. Bars: (B and C) 30 µm; (D and insets) 6 µm; (E) 1 µm. **, P < 0.01; ***, P < 0.001.

