Figure 6.
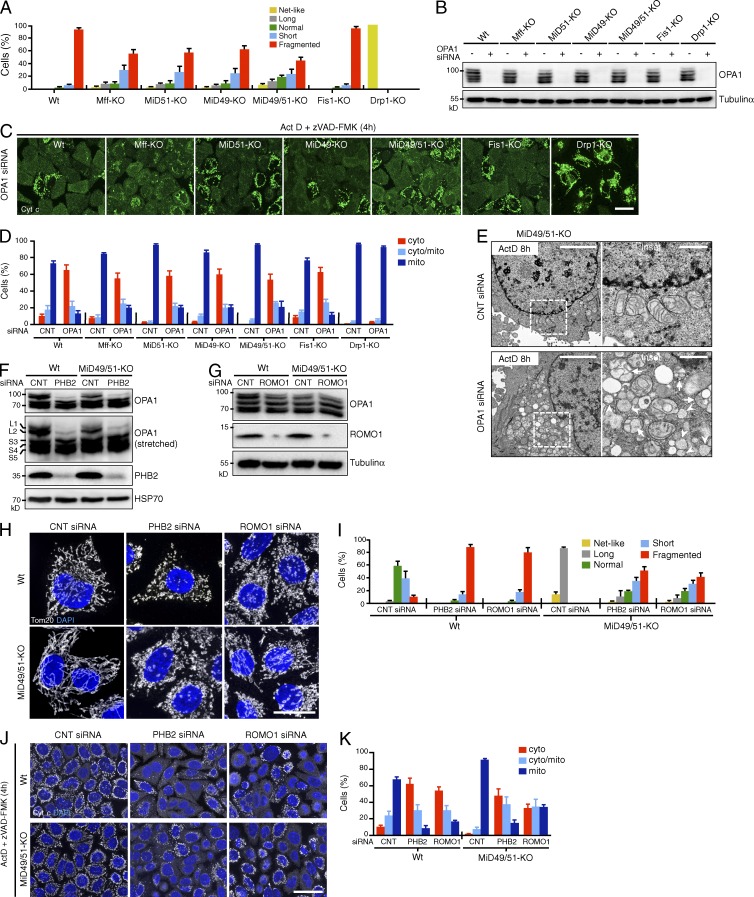
Down-regulation of OPA1, PHB2, or ROMO1 disrupts cristae morphology and restores the release of cytochrome c in MiD49/51-KO cells during apoptosis. (A–D) The indicated cells were transfected with control or OPA1 siRNA. (A) Quantified mitochondrial morphology. (B) Effect of OPA1 RNA interference as detected by Western blotting. (C) The cells in A were treated with Act D and immunostained with anti–cytochrome c antibodies. Bar, 20 µm. (D) Control and OPA1-siRNA cells were treated with Act D for 4 h and intracellular cytochrome c was quantified. (E) MiD49/51-KO cells were transfected as indicated. After 96 h, cells were treated with Act D in the presence of zVAD-FMK for 8 h and analyzed by transmission EM. Magnified images in the boxed regions are shown as insets. Bars: 4 µm; (magnification) 1 µm. Arrows, mitochondria with balloon-like structure; arrowheads, cristae-less mitochondria. (F and G) Effect of PHB2 (F) or ROMO1 (G) knockdown on OPA1 isoform patterns and the indicated proteins in the indicated cells as detected by Western blotting using the indicated antibodies. (H) Wild-type or MiD49/51-KO cells were transfected with control, PHB2, or ROMO1 siRNA. Confocal images were obtained by immunostaining for Tom20. Nuclei were stained with DAPI. Bar, 20 µm. (I) Percentages of the indicated mitochondrial morphologies of wild-type or MiD49/51-KO cells (n = 300) transfected with the indicated siRNA. (J) Wild-type or MiD49/51-KO cells were transfected as indicated. After 96 h, Act D–induced cytochrome c release was analyzed as in C. Nuclei were stained with DAPI. Bar, 30 µm. (K) Quantified cytochrome c release in J. Percentages in A, D, I, and K are means of three independent experiments with 300 cells per data point. n = 3. Data represent mean ± SD. Wt, wild type.

