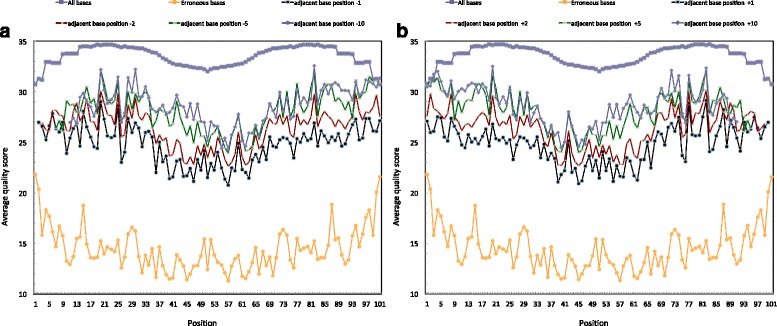
Fig. 2.

Average quality scores along reads for erroneous bases and their adjacent bases, and for all the reads for Burkholderia thailandensis. In 2(a), the purple line represents the average quality score of the full Illumina run. The orange line represents the average quality score at erroneous base positions. The other lines represent average quality scores of bases near the erroneous base at positions −1, −2, −5, and −10. In Fig. 2(b), the purple and orange lines are identical to 2(a), while the other lines represent average quality scores of bases near the erroneous base at positions +1, +2, +5, and +10
