
Fig. 3.
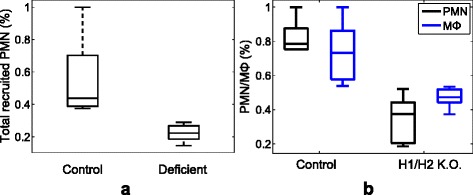
Experimental measurements for the deficiency study. a the accumulation of PMN on the control and mast cell knockout mice (5 mice for each, % of control) and (b) total recruited PMN and M Φ with H1/H2 receptor knockout (6 mice for each, % of control). The box spans the standard deviation of the data and its central mark is the median. The edges of the box shows the 25th and 75th percentiles of the data