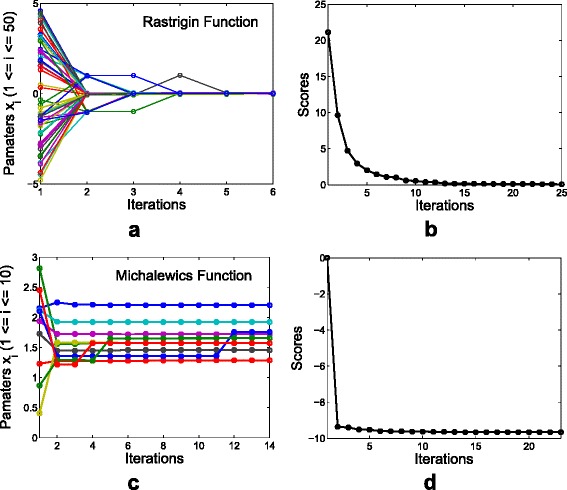
Fig. 9.

Iterations of the optimization. a illustrates the trajectories of the parameter updates on the iterations and (b) shows the score convergence of DSLM for the Rastrigin function. c and (d) are for the Michalewics function. The minimum scores of the Rastrigin function and the Michalewics function are known as zero for all of dimensional spaces, and −9.66015 for 10-dimensional space, respectively
