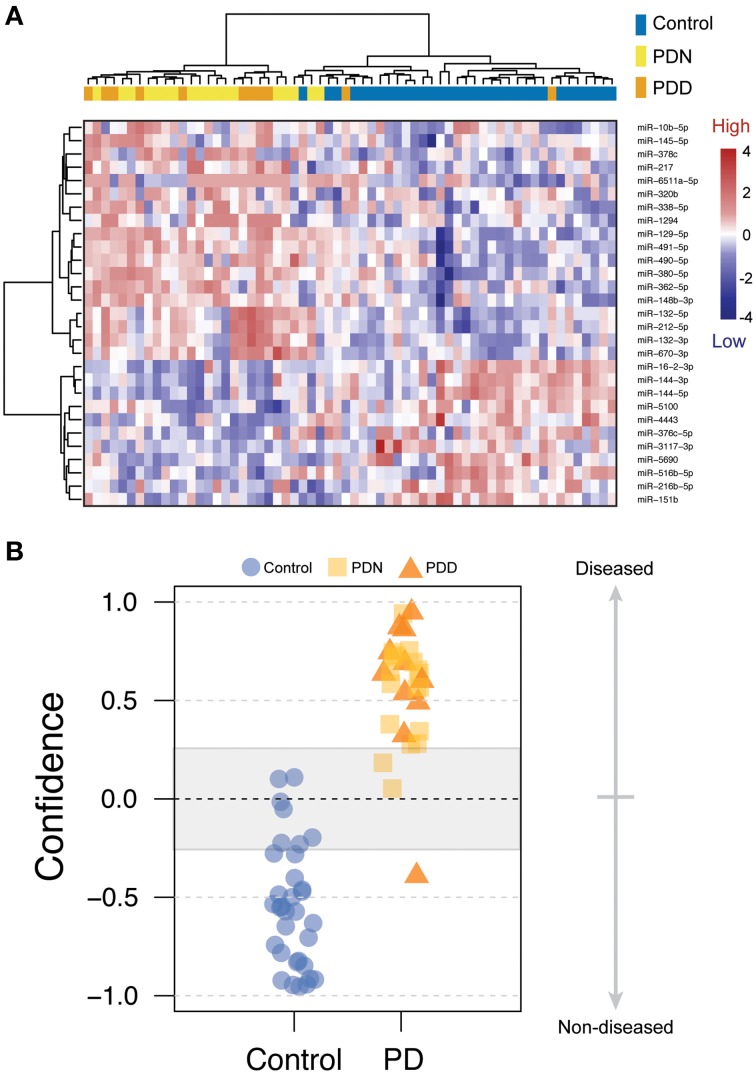
Figure 1.
miRNA changes related to Parkinson's disease. (A) Heatmap of 29 miRNAs differentially expressed between PD and control prefrontal cortex samples with log fold changes (LFC) greater than 0.5 or less than −0.5. Scaled level values are color-coded according to the legend on the right. The dendrogram on the left depicts hierarchical clustering based on level. The top dendrogram depicts clustering based on the miRNA signal from each sample. The top bar indicates disease status [blue: control, yellow: PD, non-demented (PDN), orange: PD with dementia (PDD)]. (B) Disease prediction using 29 miRNAs. Scores less than zero were called as non-diseased whereas scores above zero were called as PD. Blue circles = control, yellow boxes = PD, orange triangles = PDN.

