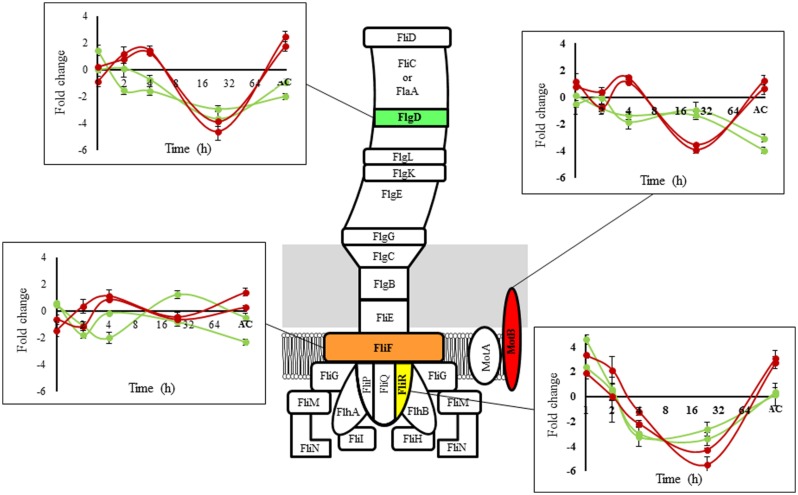
FIGURE 3.
Schematic flagellar structure of L. monocytogenes. Proteins involved are indicated. The graph shows the temporal transcriptional response at 8°C compared to 30°C for selected components (green lines: fast group, red lines: slow group; representing the same strains used in the microarray experiments). AC: Adapted culture (fast group: 4 days (cold adaptation) + 25 h (OD600 nm = 0.3) = total time 121 h; slow group: 4 days (cold adaptation) + 32 h (OD600 nm = 0.3) = total time 128 h).

