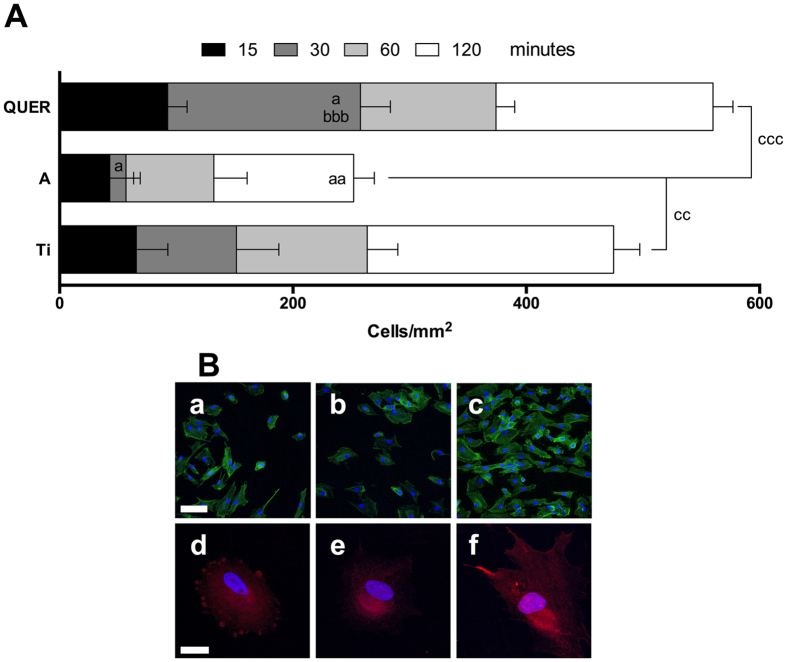
Figure 3. Adhesion of hGF to the different surfaces.
(A) Quantitative analysis of the cells adhered to the different surfaces after 15, 30, 60 and 120 minutes. (B) Cells were allowed to adhere to the surfaces for 30 min. Then, cells were stained with phalloidin-FITC (a–c; green) or with anti-vinculin antibodies (d–f; red) and nuclei were stained with DAPI (blue). Ti (a,d); A (b,e); QUER (c,f) surfaces (scale bars: upper = 100 μm; bottom = 25 μm). One, two and three symbols represent a significant difference between two groups with P ≤ 0.05, P < 0.01 and P < 0.001, respectively: (a) versus Ti for each time point; (b) versus A for each time point; (c) the total number of cells on the different surfaces was compared.

