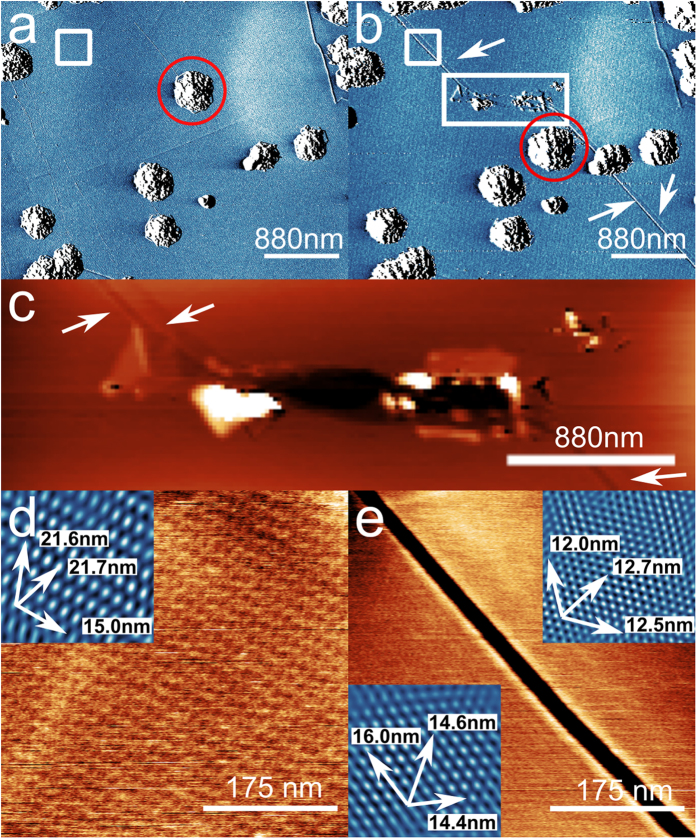
Figure 4.
AFM-induced crack generation: (a) Amplitude channel AFM image of a region on the graphene surface before and (b) after damaging the sample by scanning the AFM tip in contact mode. The rectangular box in (b) shows the position of the damaged region and the arrows show the propagation of cracks away from the damaged area. In addition the red circle shows the displacement of a carbon deposit before and after the damage; (c) Detail of the damage introduced by the cantilever with arrows indicating cracks propagating away from the damage; (d) topographic image of the region indicated by the white box in (a); (inset) phase image showing the moiré period in different directions; (e) Height image of the same area after the formation of a crack as indicated by the box in (b); (insets) Filtered phase images of each side of the crack showing the reduction in moiré period in all directions indicating the strain has been relaxed.

