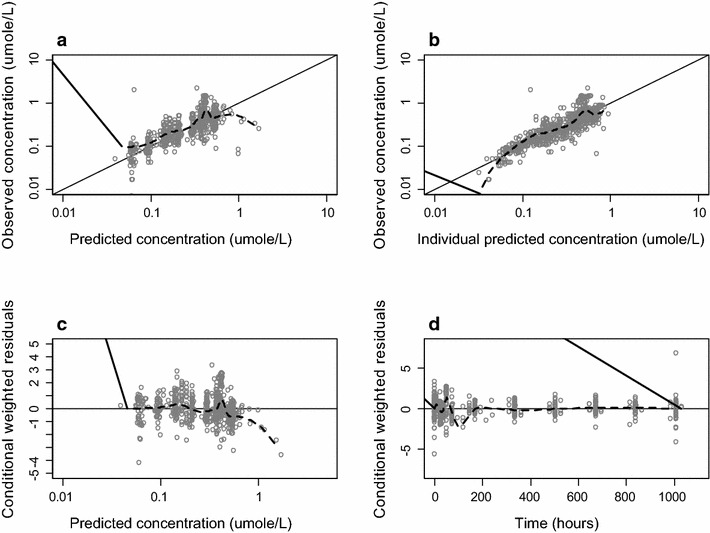
Fig. 3.

Goodness of fit plots of desethylchloroquine. Plots of the observed versus population predicted concentrations (a) and observed versus individual predicted concentrations (b). Weighed individual residuals versus individual predictions (c) and weighed residuals versus time (d). The black line is a non-parametric smoother describing the trend and the black line is the line of unity
