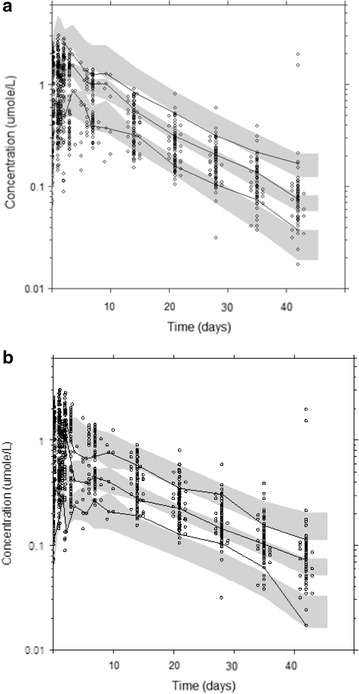
Fig. 4.

Plots from the visual predictive check for chloroquine (a) and desethylchloroquine (b) observations. The middle solid lines represent the median of simulated predictions by the final model. The dashed black lines represent the corresponding percentiles for the true observations. The black dots are the true observations and the grey shaded areas are the 95 % confidence intervals for the simulations. The decline in the upper percentiles of desethylchloroquine is due to base line values in the subjects
