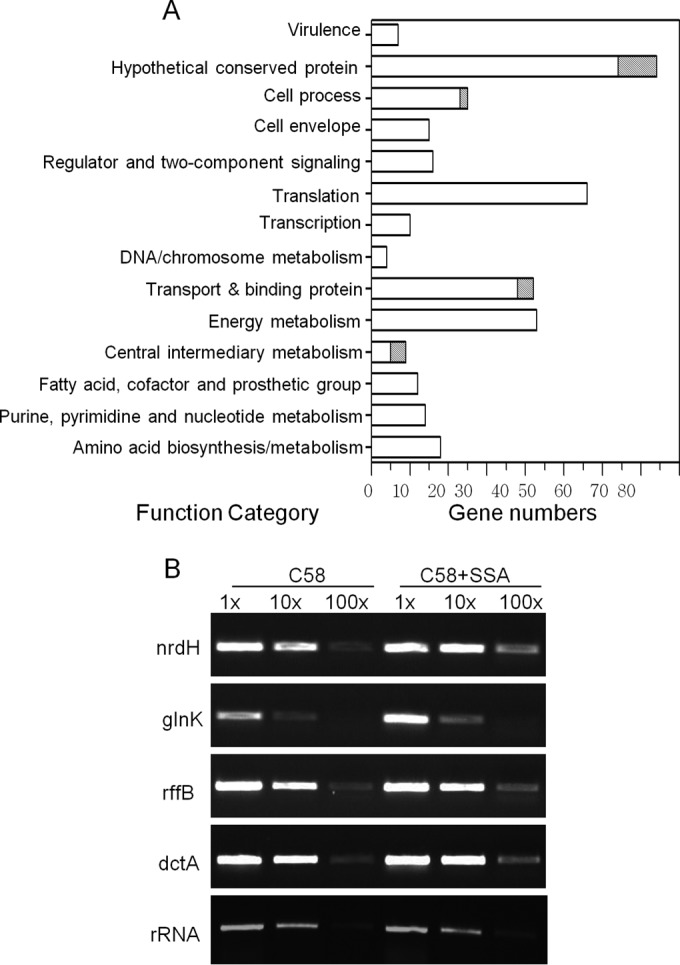
FIG 1.

Microarray analyses of A. tumefaciens A6 with or without SSA treatment. (A) Functional groups and the numbers of genes whose expression levels were upregulated (open bars) or repressed (shaded bars) by external addition of SSA. Genes are categorized into functional classes based on the annotation available from the A. tumefaciens genome sequences (24, 25). (B) Validation of microarray results by RT-PCR.
