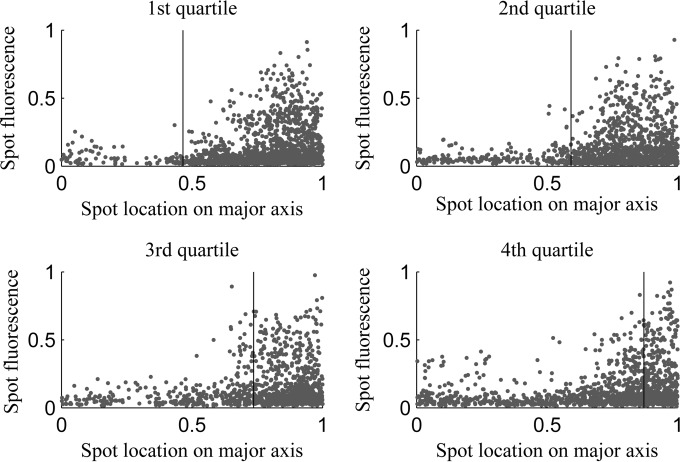
FIG 4.
Individual aggregate intensity versus location along the major cell axes for cells of each quartile. Shown are all positions occupied by aggregates during a cell's lifetime along with the mean relative position of the nucleoid border in cells of each of the quartiles along the major axis (vertical line).

