FIG 3.
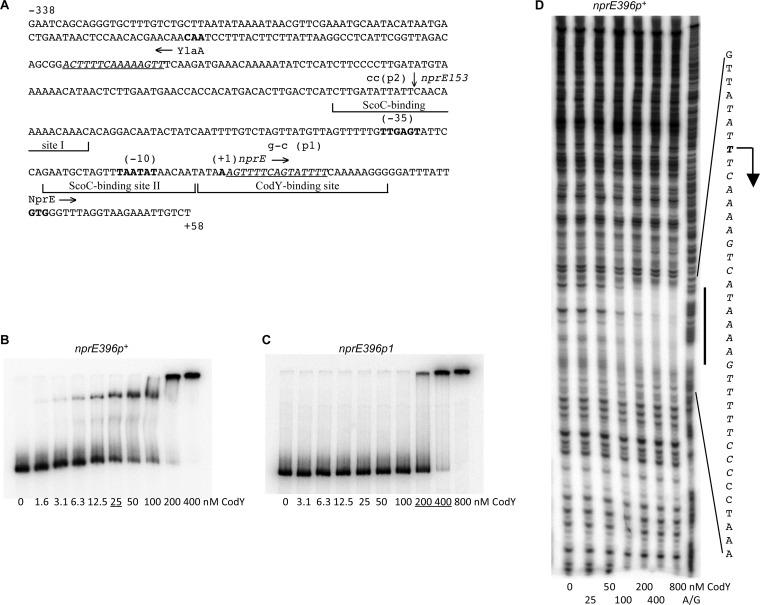
Binding of CodY to the nprE regulatory region. (A) Sequence (5′ to 3′) of the coding (nontemplate) strand of the nprE regulatory region within the nprE396-lacZ fusion. The 5′ and 3′ nucleotides of the sequence presented correspond to the first and last nucleotides of the nprE insert within the fusion. Coordinates are reported with respect to the transcription start point (60). The upstream boundary of the nprE153-lacZ fusion, at position −95, is indicated by a vertical arrow above the sequence. The likely translation initiation codon, the −10 and −35 promoter regions, and the transcription start point are shown in bold. The directions of transcription and translation are indicated by horizontal arrows. The sequences that were protected by CodY or ScoC (12) in DNase I footprinting experiments are shown by bracketed lines. The sequences of the two CodY-binding motifs, with three or four mismatches each, are italicized and underlined. The mutated nucleotides are shown in lowercase above the sequence. (B and C) Gel shift assays of CodY binding to nprE fragments. The nprE396p+ (B) and nprE396p1 (C) DNA fragments obtained with oligonucleotides oBB67 and oBB102, using pGB2 and pGB6, respectively, as templates, and labeled on the template strand were incubated with increasing amounts of purified CodY in the presence of 10 mM ILV. CodY concentrations used (nanomolar [monomers]) are reported below the lanes; concentrations corresponding to the apparent KD for binding are underlined. (D) DNase I footprinting analysis of CodY binding to the nprE regulatory region. The nprE396p+ DNA fragment used for panel B was incubated with increasing amounts of purified CodY in the presence of 10 mM ILV and then with DNase I. The protected area is indicated by a vertical line, and the corresponding sequence is reported; the protected nucleotides are italicized. The apparent transcription start point and direction of transcription are shown by a bent arrow. CodY concentrations used (monomers) are indicated below the lanes. The A+G sequencing ladder of the template DNA strand is shown in the right lane.

