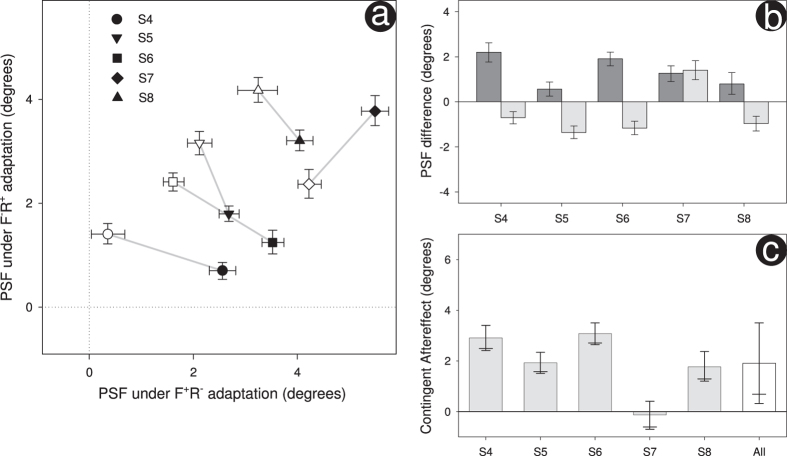
Figure 2.
Results for the repeat of our initial experiment are shown in (a–c) – these graphs mirror those shown in Fig. 1b–d. As before, all error bars show 95% confidence limits except for (c) where the lower 90% are also shown (longer horizontal). Results collapsed across our 5 additional observers are shown in (c) denoted by “All”. Here error bars are derived from the t distribution (t(4) = 3.33, p = 0.03), elsewhere errors bars were determined using bootstrapping.

