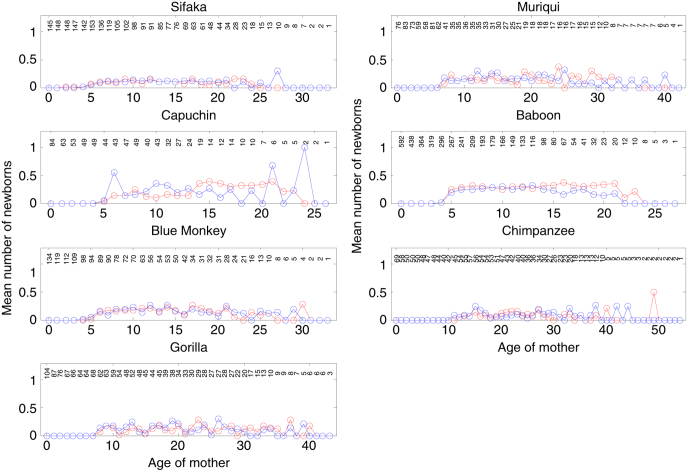
Figure 2. Age-specific probability of producing a son (blue) versus a daughter (red).
Plotted values are the weighted number of sons or daughters divided by the weighted number of mothers (Nm.x in Table 2A in Data Citation 1). Numbers at the top of each panel give the (unweighted) number of mothers in each age interval. There is no striking evidence that offspring sex ratio varies with the age of the mother. These estimates necessarily ignore offspring that died before their sex could be determined, which are not ignored in the estimates of m.x in Table 2A in Data Citation 1.

