
Figure 7. Standard deviation (1 January 1993–31 December 2014) fields are shown in colour for SLA for AVISO+TG (top) and AVISO (bottom).
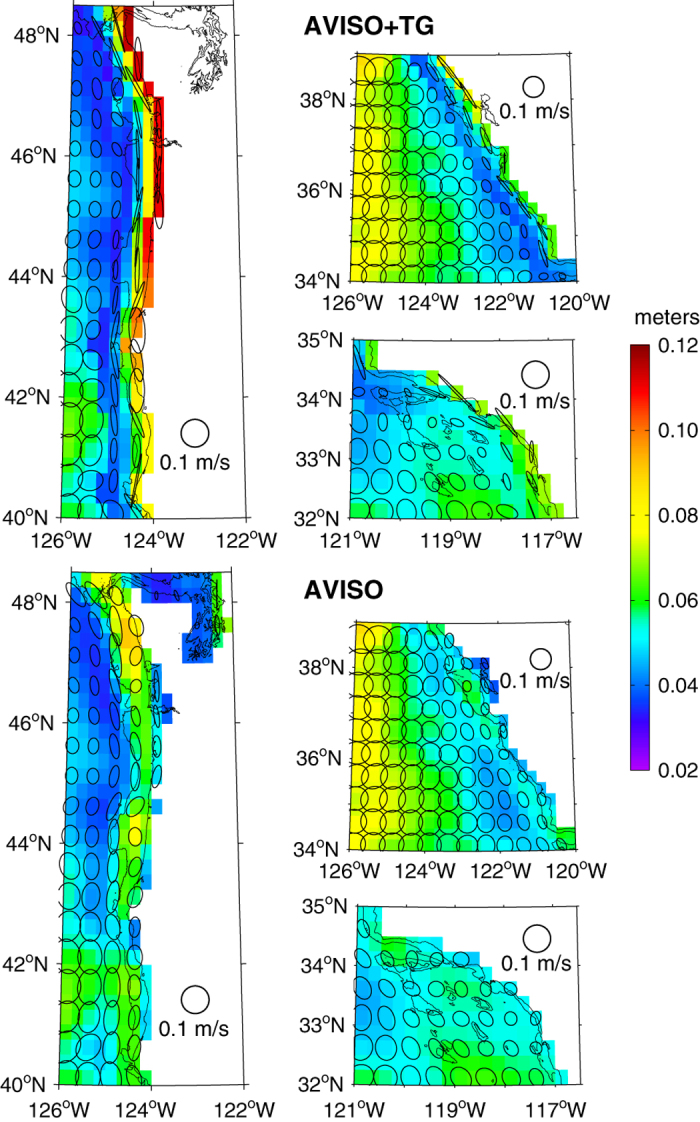
Overlaid are variance ellipses showing geostrophic current standard deviations as the lengths of the principal and secondary axes. Every second ellipse is plotted for clarity. The black line indicates the 200 m isobath.