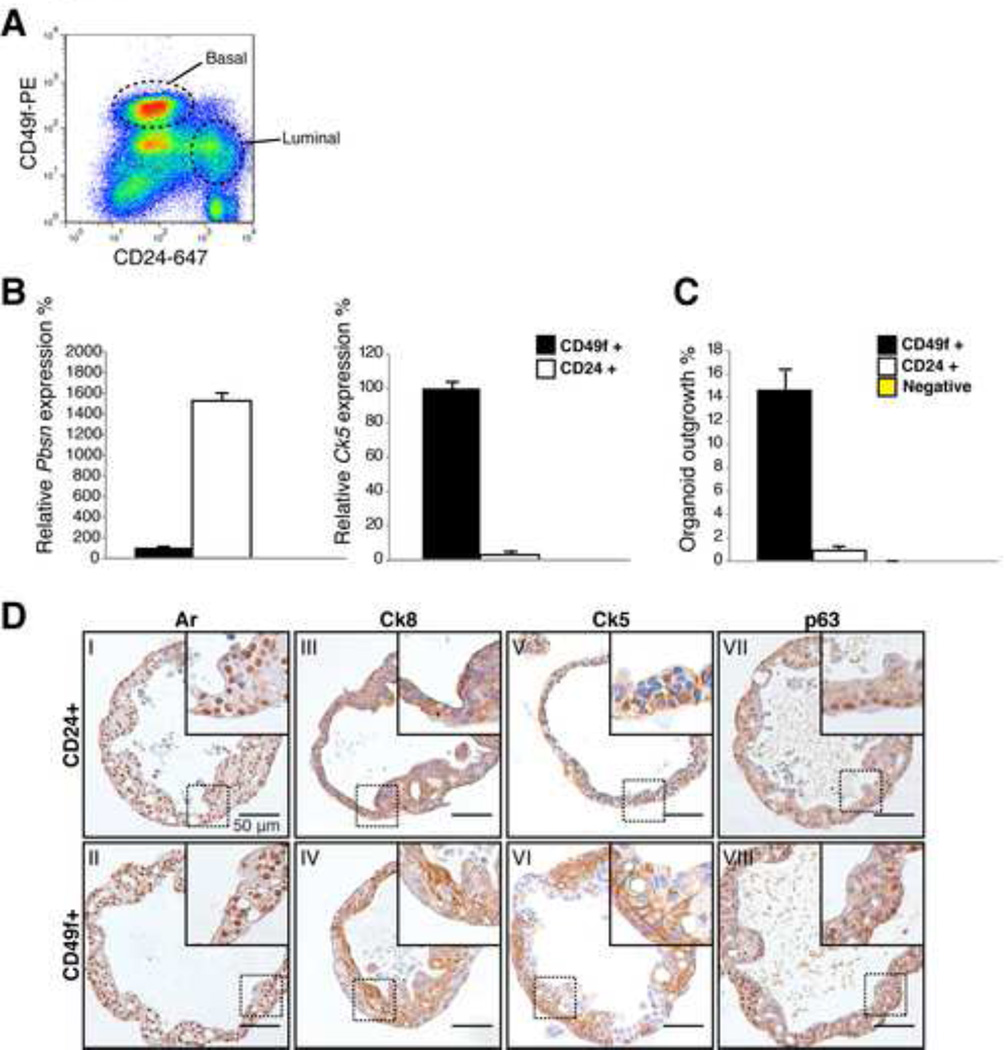
Figure 2. Basal and luminal cells give rise to organoids.
A: FACS plot of CD24 (luminal) CD49f (basal) stained murine prostate.
B: Quantitative RT-PCR expression analysis of basal (Ck5) and luminal (Probasin, Pbsn) marker expression in CD24+ luminal and CD49f+ basal cells. Pbsn is strongly expressed in luminal cells, Ck5 is strongly expressed in basal cells. Expression was normalized to Hprt. Results are shown as mean ± SD.
C: Percentage of organoids established by 200 single cells 14 days post seeding. Approximately 15% of basal cells generate an organoid. 1% of luminal cells generate an organoid. Results are shown as mean ± SD.
D: IHC stainings of single cell derived murine prostate organoids, showing similar staining patterns of Ar (I-II), Ck8 (III-IV), Ck5 (V-VI) and p63 (VII-VIII) and morphology, showing that basal cells and luminal cells are both capable of giving rise to both epithelial lineages.
Scale bars represent 50 microns.
See also Figure S2

