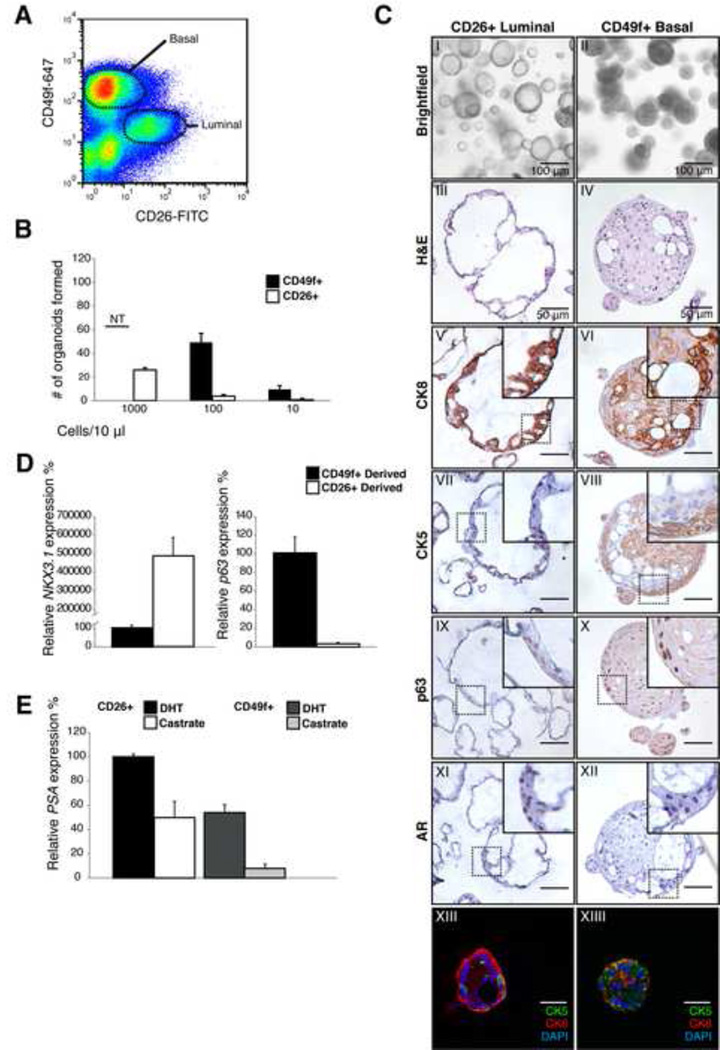
Figure 5. Establishment of human prostate organoid cultures from luminal and basal cells.
A: FACS plot of human prostate cells stained with CD26 (luminal) and CD49f (basal) markers
B: Organoid outgrowth from CD49f+ basal and CD26+ luminal cells at varying densities. Results are shown as mean ± SD. *NT, Non Testable. At higher densities CD49f-derived organoids fuse, making counting of organoid number therefore unreliable.
C: Analysis of CD26-derived (luminal) and CD49f-derived (basal) organoids at passage 4. Brightfield picture (I-II) H&E staining (III-IV) CK8 (V-VI) CK5 (VII-VIII) p63 (IX-X) AR (XI-XII) IF stain of CK5 (green) and CK8 (red) showing distinct basal and luminal cells (XIII-XIV). Scale bars represent 50 microns.
D: Quantitative RT-PCR expression analysis of the luminal marker NKX3.1 and basal marker p63 in luminal and basal organoids at passage 4. Expression was normalized to GAPDH. Results are shown as mean ± SD.
E: Quantitative RT-PCR of the AR target PSA in the presence of DHT (1 nM) and in castrate conditions (24 hours). Increased PSA mRNA levels are observed in both luminal- and basal-derived organoids after DHT treatment. Expression was normalized to GAPDH. Results are shown as mean ± SD.
See also Figure S5

