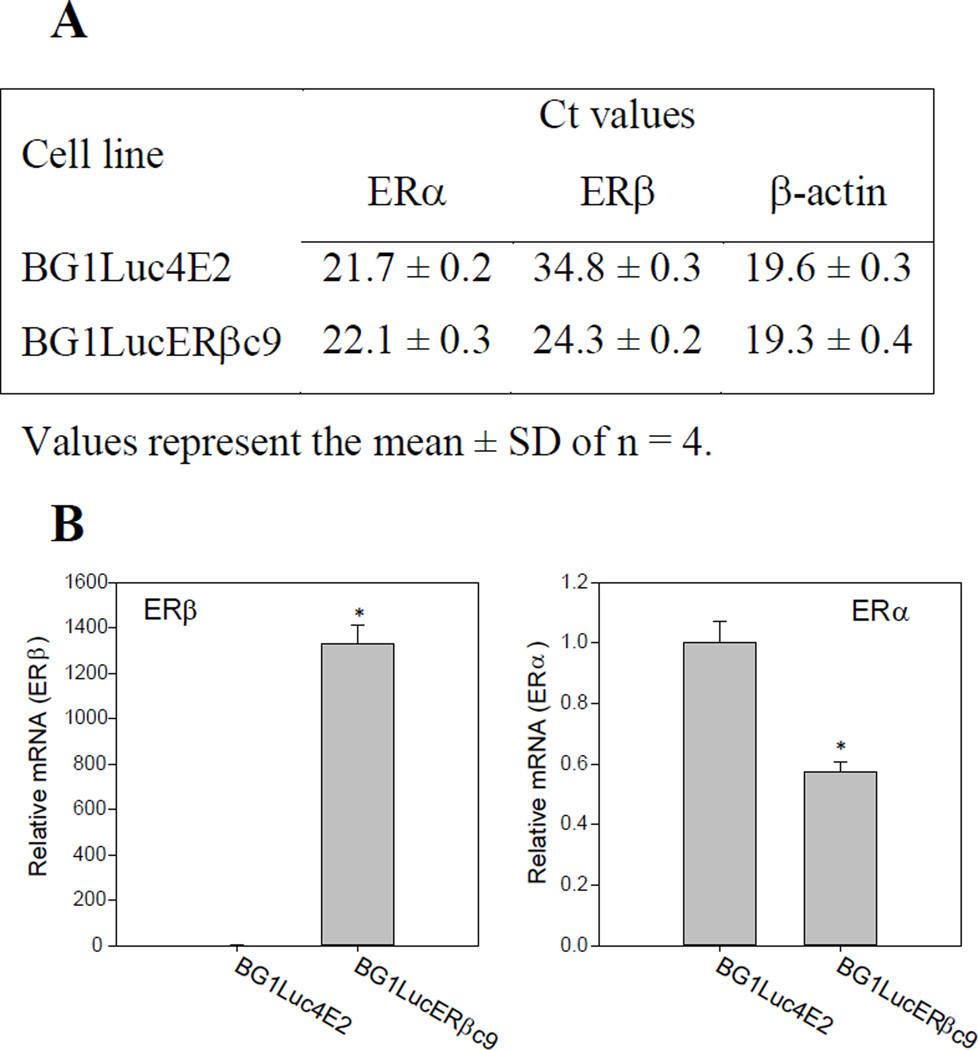
Figure 4.
Comparison of ERβ and ERα mRNA levels in BG1Luc4E2 and BG1LucERβc9 cells. (A) Threshold cycle values for ERα, ERβ, and β-actin mRNA levels in BG1Luc4E2 and BG1LucERβc9 cells. (B) Expression of ERβ and ERα mRNA in BG1LucERβc9 cells. Results represent the mean ± SD of four determinations, and ER mRNA levels were normalized to that of β-actin and expressed relative to levels in BG1Luc4E2 cells as described in Materials and Methods. Significant difference (p < 0.05, determined by Student’s t-test) in relative ERβ or ERα mRNA levels in BG1LucERβc9 cells from that of levels in BG1Luc4E2 cells is indicated by an asterisk *.

