
Fig. 3.
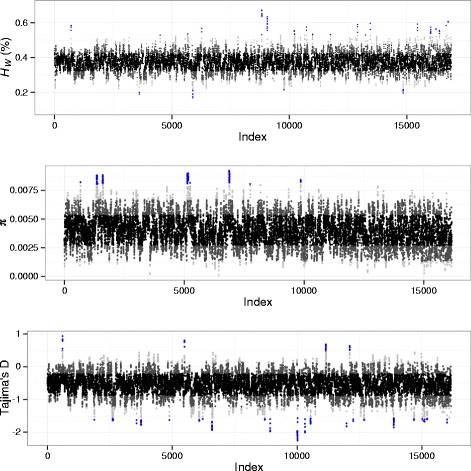
Patterns of genome-wide polymorphism in Aiptasia. Genome-wide statistics were calculated in 100 kb sliding windows across the genome with a step size of 10 kb, with contigs sorted along the x-axis from longest to shortest. Each point represents a single 100 kb window and is colored according to standard deviation from the mean (black: within 1 SD, dark grey: 1–2 SD, light grey: 2–3 SD, blue: >3 SD). Proportion of heterozygous genotypes at SNP sites in a window (H W , upper panel), average pairwise nucleotide diversity (π, middle panel), and Tajima’s D (lower panel) are shown