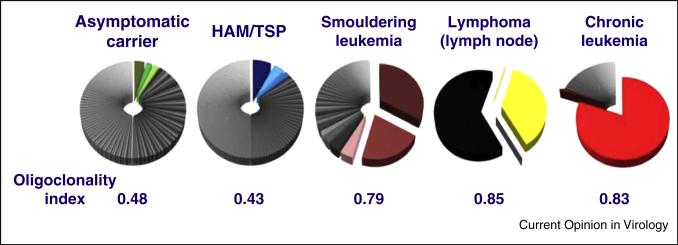
Figure 2.
Frequency distribution of HTLV-1-infected T-cell clones in different manifestations of HTLV-1 infection. Each pie-chart shows the clones identified in 10 μg of genomic DNA from the peripheral blood mononuclear cells of a single representative host. The size of each sector represents the relative abundance of that clone in the individual's proviral load. The oligoclonality index (OCI) (also known as the Gini index) is a measure of the non-uniformity of the frequency distribution (71). OCI = 0 implies that all clones have the same frequency; OCI = 1 implies that only a single clone is present.
These data were reported in Figure 2A of Gillet et al. [71].

