Figure 3.
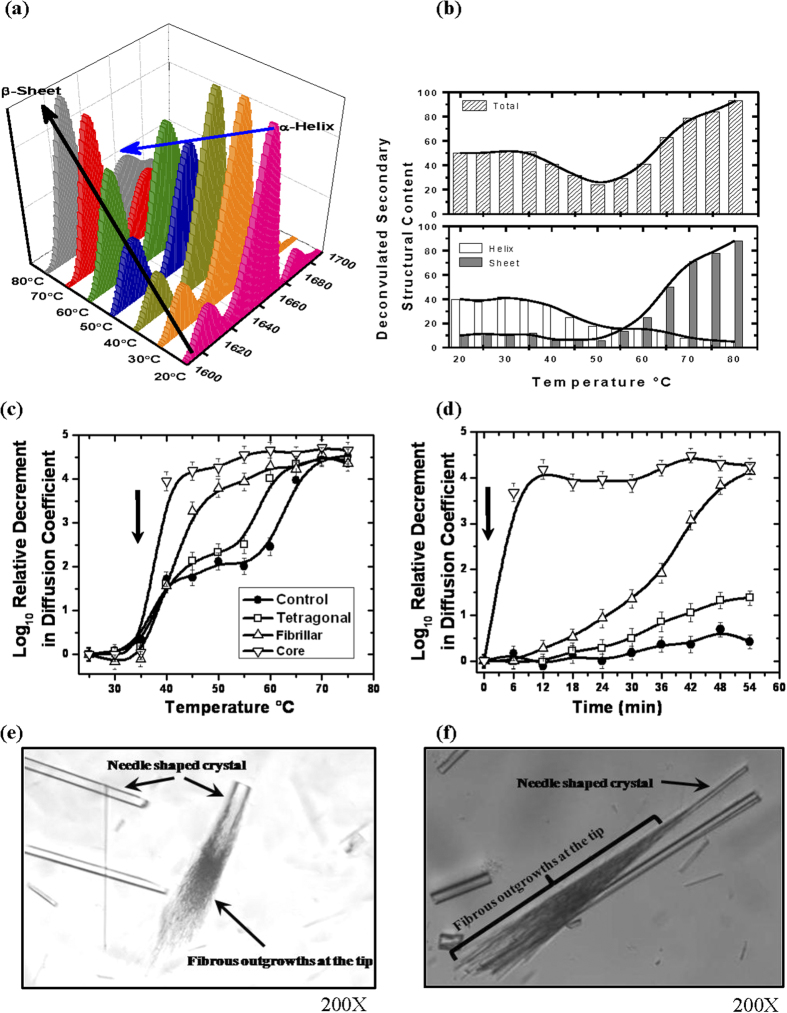
Effect of temperature on secondary structure and seeding on lysozyme (a) FTIR spectra of lysozyme (20 mg/ml) in buffer with 700 mM NaCl in the region of amid-1 band. Spectra shows changes in α-helical and β-sheet content as a function of temperature. (b) Deconvulation of the acquired FTIR data showed changes in total secondary content (upper panel) and, α-helix (◻s) and β-sheet ( ) between 20 to 85 °C (lower panel). (c) DLS data of 20 mg/ml lysozyme without any seeds (-●-), seeded with crushed tetragonal crystals (-◻-), seeded with fibrillar crystals (-∆-) and seeded with white core (-∇-) as a function of temperature. Arrow represents the temperature at which seeds were incubated into solution. (Lines are spline curves plotted to guide the eye on the trend). (d) Tracking of relative decrement in the diffusion coefficient of lysozyme without any seeds (-●-), with seeds of: crushed tetragonal (-◻-), fibrillar crystals (-∆-) and seeds from core (-∇-) as a function of time. Arrow represents time of addition of crushed crystals or core. (Lines are spline curves plotted to guide the eye on the trend). (e,f) Two close-up images of the needle shaped crystals abstracted from spherulites to grow them further in lysozyme solution at 45 °C. “Broomy” or fibrillar outgrowths were seen on one end of these crystals support that these crystals are competent nucleation sites for fibrillar organization.

