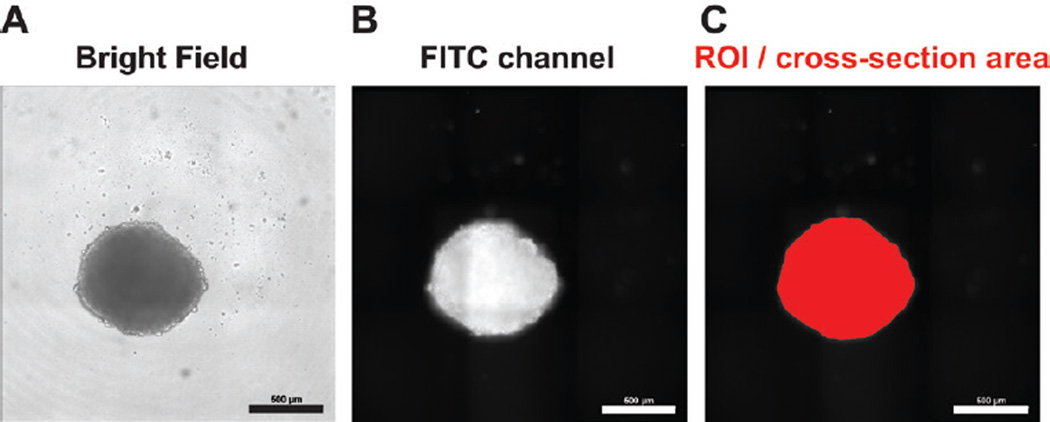
Figure 1. Comparison of neurosphere images acquired by bright-field and fluorescence microscopy, and the final analyzed image.
U87 neurosphere cells (1000 cells per well) were seeded into round-bottom 96-well plates in 100 µl cancer stem cell (CSC) medium. After 2 weeks, neurospheres were stained with acridine orange (AO) by adding 1 µl CSC medium containing 10 µg/mL AO for 1 h. Subsequently, neurospheres were subjected to microscopy. The same neurosphere was visualized by bright-field microscopy (A) and using the FITC channel to detect AO-positive neurosphere cells (B). (C) The region of interest (ROI) in red identified by the HCA/JOBS software was used to determine neurosphere cross-section area. Scale bar: 500 µm.

