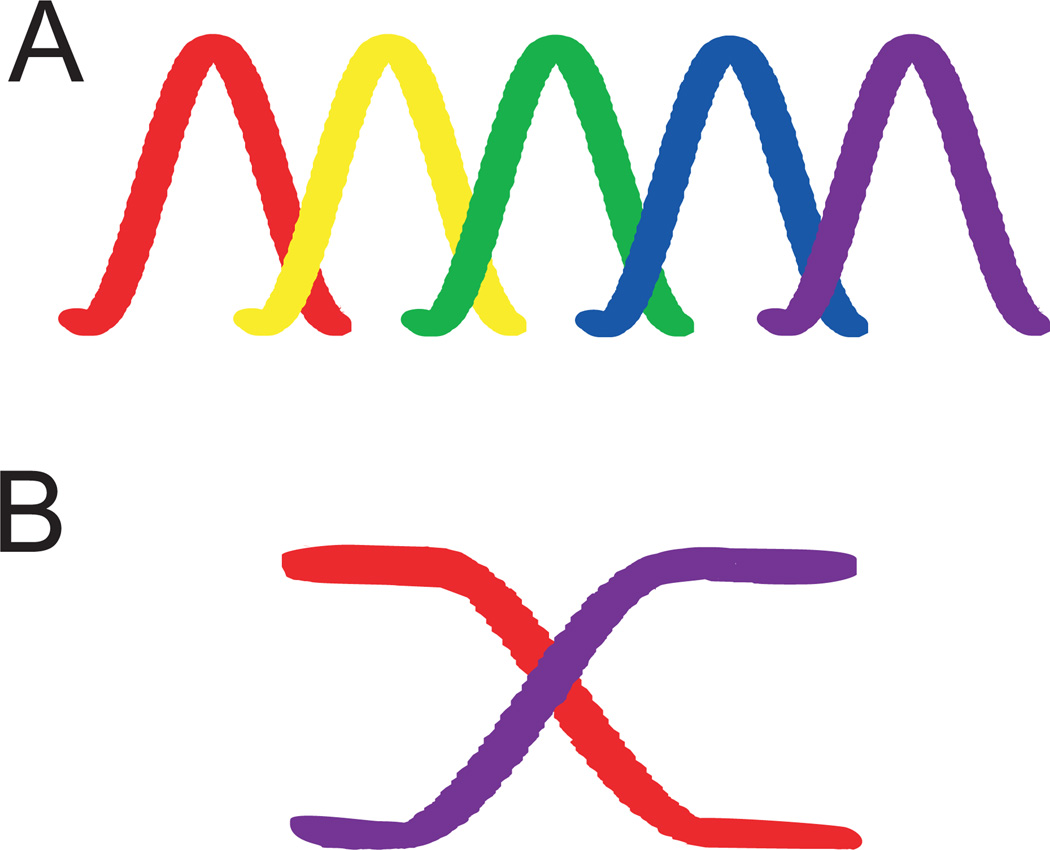
Figure 1. Map vs. meter coding strategies.
A. Place code, where tuning curves for best ITDs are homogenously distributed over the physiological range of ITDs, exemplified by the barn owl NL.
B. Population code, where two populations of neurons with broad tuning curves can encode change in ITD through changes in firing rate, exemplified by lizard auditory nerve. In the population code, the peaks of the tuning curves may lie outside the physiological range.

