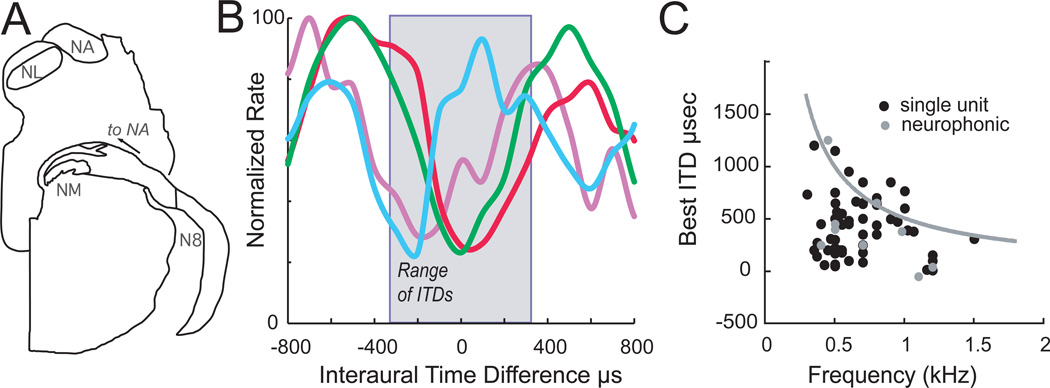
Figure 2. ITD coding within alligator NL.
A. Schematic cross sections through the alligator brainstem at the level of the 8th nerve, showing the cochlear nucleus magnocellularis (NM) and the ascending nerve root to cochlear nucleus angularis (NA).
B. Interaural delay curves plot the response of NL neurons against changing ITDs in alligator. Five single-unit recordings were selected from left hand NL recordings to display a range of different best ITDs in the contralateral hemifield, i.e. positive ITDs. One had a peak within the physiological range of ITDs (pale line); three were outside.
C. Best ITDs were distributed throughout the contralateral hemifield. Like all animals described so far, best ITDs showed less scatter with increasing best frequency for all single units (black circles) and neurophonic recordings (gray circles). The gray line follows ITD values corresponding to 0.5 cycle, the “pi-limit.” Data for B and C modified from Carr et al. (2009).

