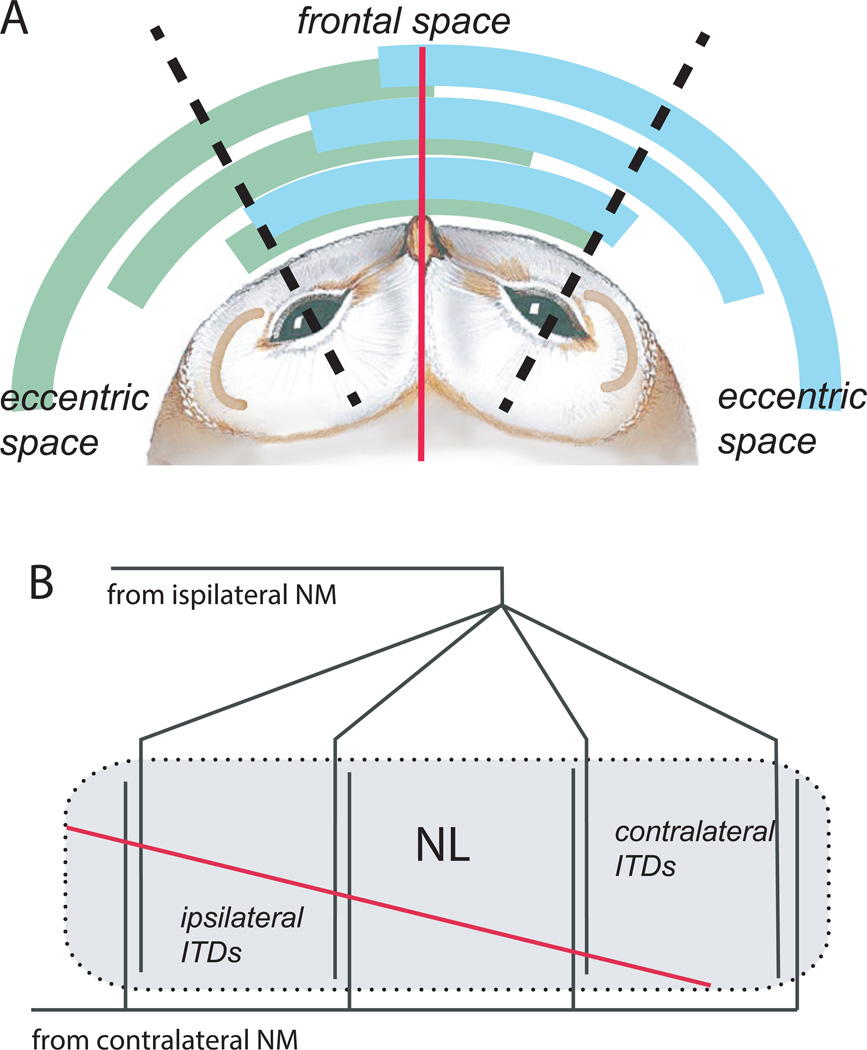
Figure 3. Maps of ITD in the barn owl.
A. Frontal space is represented in both NLs, to create an overlapping representation of the 30° region on either side of the midline (red line, marks 0µs ITD), schematized by the overlapping arcs between dashed black lines.
B. The range of ITDs mapped in NL shifts, so that frontal space is mapped throughout NL. In medial NL, more frontal space is mapped, so medial NL on both sides contains maps both ipsilateral and contralateral ITDs (arcs closest to owl), while more and more contralateral space is mapped in central and lateral NL. The range of ITDs mapped in lateral regions of NL encompasses the most eccentric space.

