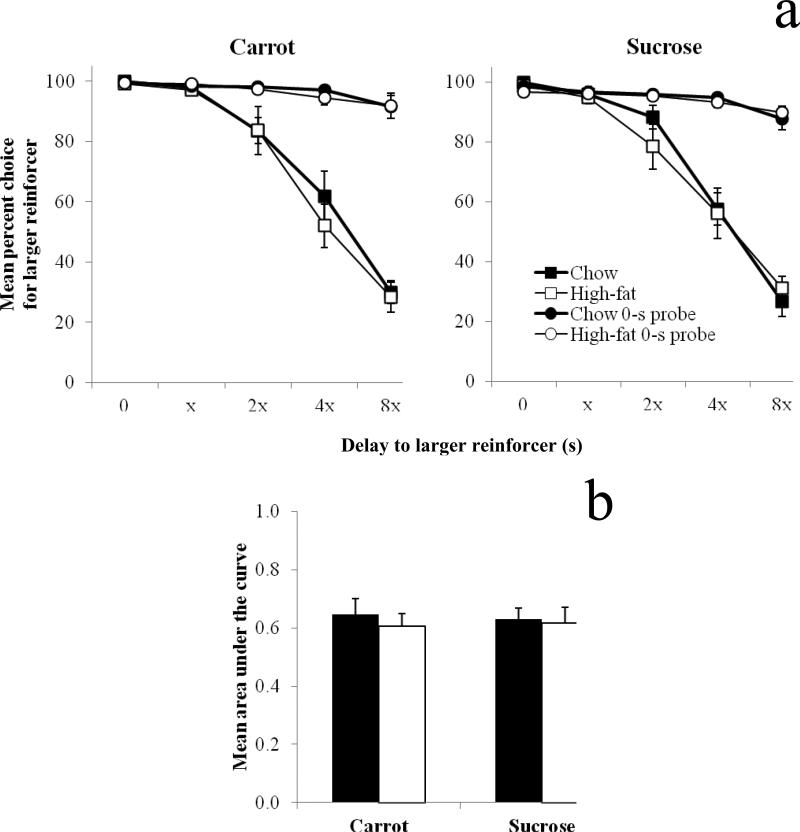
Fig. 2.
Mean (±SEM) percent choice for the larger reinforcer as a function of delay in both the delay (squares) and 0-s probe (circles) sessions (a) and mean (±SEM) area under the curve (b) for standard-chow (black bars) and high-fat (white bars) diet rats in the carrot- and sucrose-pellet conditions. Because delay series were individualized for each rat, delays to the larger reinforcer are presented as a function of the lowest non-zero delay (x) in a delay series

