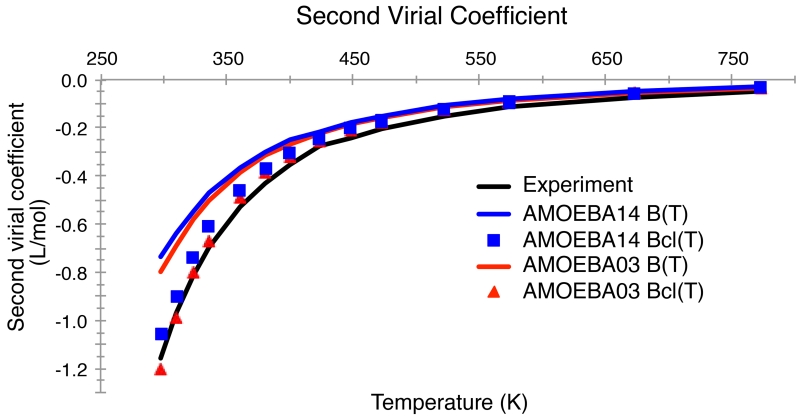
Figure 3.
Second virial coefficient of water as a function of temperature for the AMOEBA03 and AMOEBA14 models for temperatures from 249 K to 373 K and atmospheric pressure (1 atm). The Bcl(T) curves show the classical second virial coefficient, while the B(T) curves have translational and rotational quantum corrections added to the classical results. Experimental values are from References 106 and 107.

