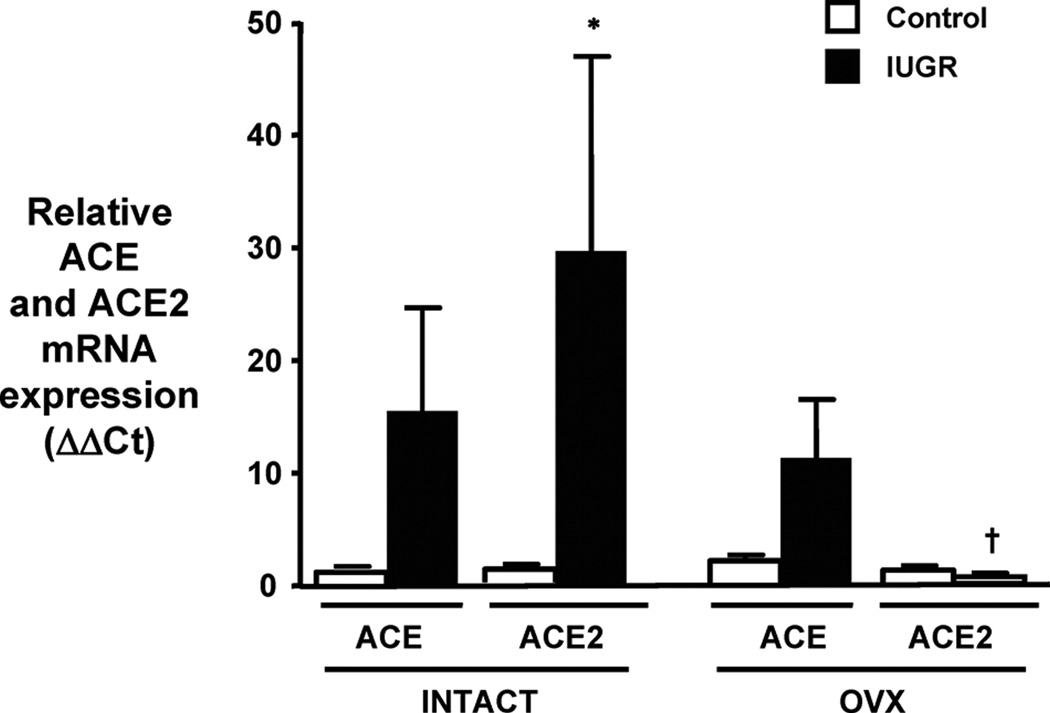
Figure 17.
Renal ACE and ACE2 mRNA expression in intact and ovariectomized control and IUGR offspring. Renal ACE and ACE2 mRNA expressions were assessed using real-time PCR. Results were calculated using the 2−ΔΔCT method and expressed in folds increase/decrease of the gene of interest; control-intact (n=7), IUGR-intact (n=7), control-OVX (n=7), and IUGR-OVX (n=8). *P<0.05 vs control-intact ACE2. †P<0.05 vs IUGR-intact ACE2. All of the data are expressed as mean±SEM. (Used with permission, Figure 5, 144).

