
Figure 1.
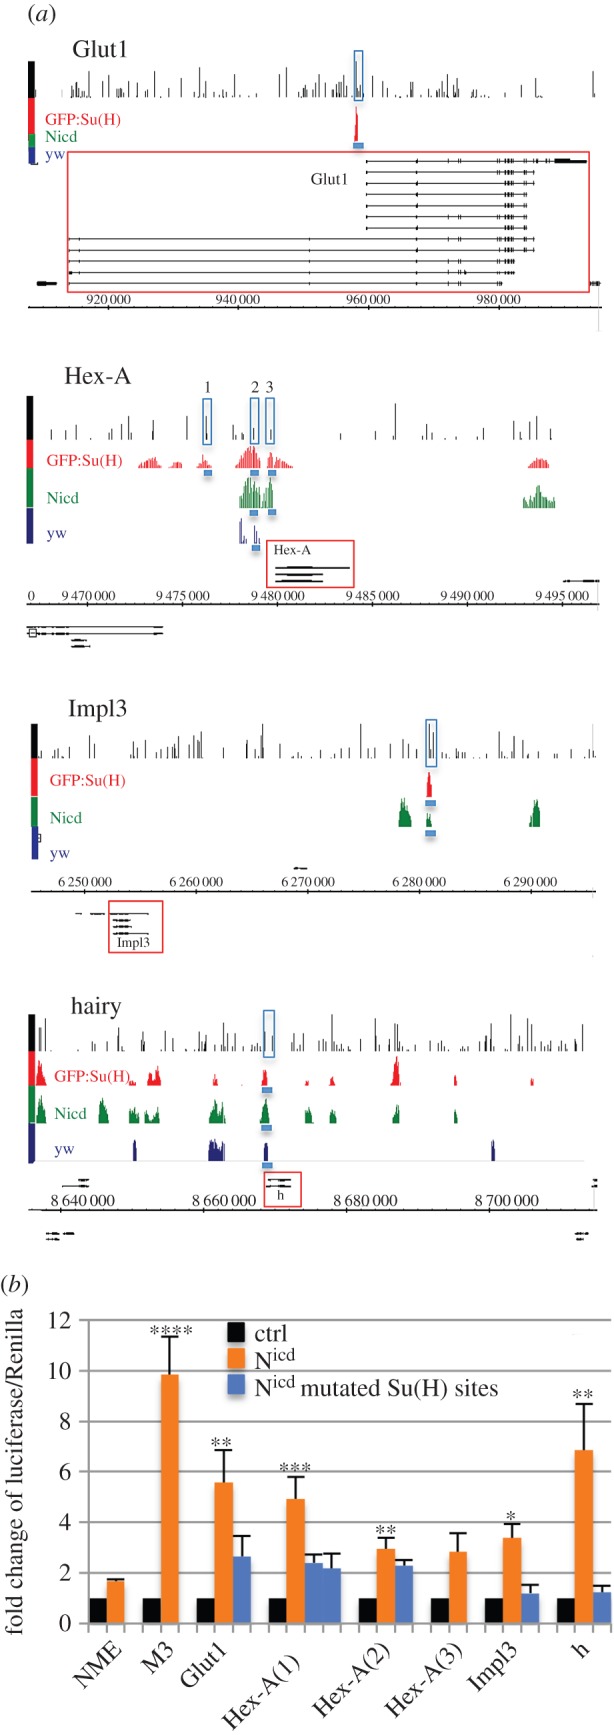
(Opposite.) The binding profile of Su(H) at regulatory regions of metabolism-related genes. (a) Genomic regions of Glut1, Hex-A, Impl3 and hairy show Su(H) ChIP peaks (enrichment relative to input, log2 scale 0–4) in wing discs from yw (dark blue), ptc-Gal4 > Nicd (green) and ptc-Gal4 > GFP:Su(H) discs (red) [24]. Black lines in first rows indicate computationally predicted Su(H) binding sites based on Patser Su(H) matrix. Gene models are depicted in black, horizontal numbering indicates genomic coordinates according to release 5 of Drosophila genome (BDGP R5.12/dm3). Genomic regions cloned for luciferase assays are indicated by blue rectangles. (b) Luciferase assay in S2 cells using genomic regions indicated in (a). NME is negative control (Notch mutant enhancer); M3 contains Notch responsive element from bHLHm3. Blue columns indicate responses of the same regions where Su(H) sites were mutated. Two different Su(H) sites were mutated in Hex-A region 1. Significance is shown according to Kruskal–Wallis test, comparing groups against NME.