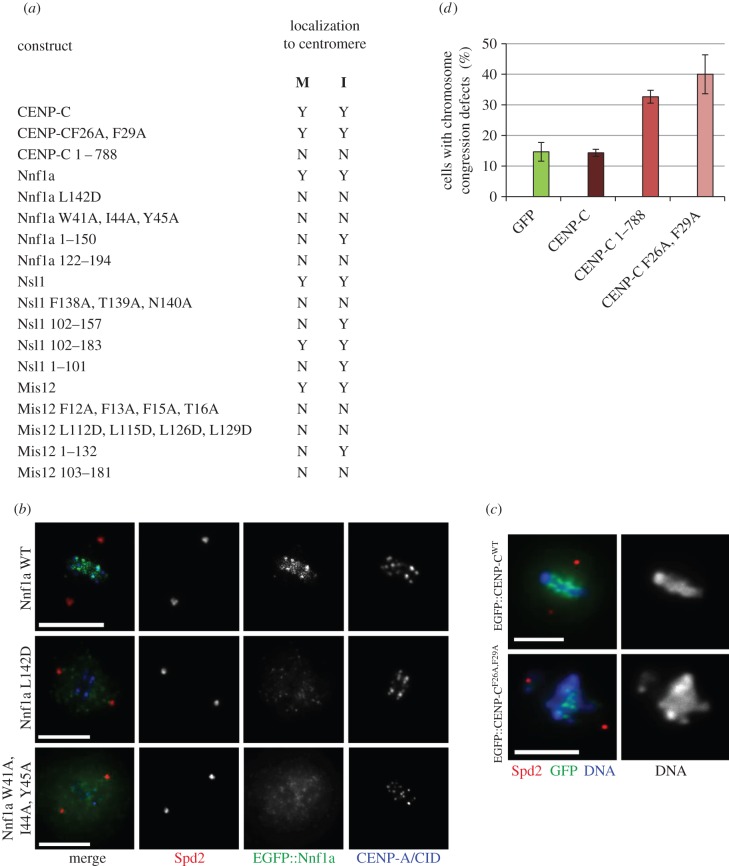
Figure 7.
Disruption of interaction surfaces leads to mislocalization of Mis12C components and chromosome segregation defects. (a) Table showing localization of different CENP-C, Nnf1a, Mis12 and Nsl1 truncations and mutants in mitosis and interphase of D.mel-2 cells. ‘M’ describes the localization during mitosis, ‘I’ the localization in interphase. (b) Mutation of residues responsible for the physical interactions between the Mis12 complex subunits leads to the mislocalization of the kinetochore components. An example is given for cells expressing WT, L142D or a triple W41A, I44A, Y45A mutant of Nnf1a fused with EGFP. Wild-type protein localizes to mitotic centromeres marked by the CID/CENP-A signals, whereas EGFP::Nnf1aL142D and EGFP::Nnf1aW41A,I44A,Y45A are diffuse. Anti-Spd2 staining shows centrosomes. Scale bar in (c,d) represents 5 µm. (c) Expression of the CENP-CF26A,F29A in D.mel-2 cells induces chromosomal aberration phenotype. Examples of control metaphase cells expressing a control EGFP::CENP-CWT construct and a mutant EGFP::CENP-CF26A,F29A. Cells were stained with anti-Spd2 to show centrosomes and DAPI to visualize DNA. The graph displaying the quantification of this phenotype is given in panel (d). (d) Quantification of improperly congressed or scattered chromosomes in EGFP-, EGFP::CENP-C-, EGFP::CENP-C1–788- and EGFP::CENP-CF26A,F29A-expressing cells. Fourteen per cent of the EGFP-expressing cells (n = 100), 14% of the EGFP::CENP-C-expressing cells (n = 100), 32% of the EGFP::CENP-C1–788-expressing cells (n = 100) and 40% of EGFP::CENP-CF26A,F29A-expressing cells (n = 100) showed chromosome congression defects.

